Dear Members,
We have released 9th Dec’17 – Coverage closure update on Mazda and Chaman Lal Setia and Sep’17 earnings update on Poddar Pigments and Control Print. The same have been produced below. For other updates, please log into the website at the following link – https://katalystwealth.com/index.php/my-account/
Date: 9th Dec’17
9th Dec’17 – Mazda and Chaman Lal Closure and Sep’17 Earnings update
Mazda (NSE – MAZDA) – May’14 Alpha stock
CMP – 381.00 (BSE); 374.05 (NSE)
Rating – Negative and coverage closure; this is not an investment advice (refer rating interpretation)
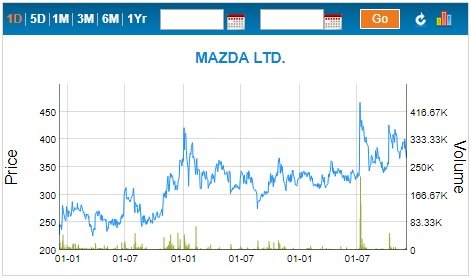
Mazda 3 years price chart Source: BSE India
Off-late, a lot of stocks have got re-rated while the performances of the companies have failed to match up. Mazda falls into the same category, because over the last 4-5 years the stock has appreciated from 90 odd levels to around current levels of 380; however the company’s performance has more or less remain unchanged.
Mazda’s core engineering business has been going downhill in terms of performance and the management seems to be lacking in aggression in taking the business to higher levels and we therefore have a negative rating on the stock and also closing coverage on the same.
Chaman Lal Setia Exports (BSE – 530307) – Nov’16 Alpha stock
CMP – 150.30 (BSE)
Rating – Negative and coverage closure; this is not an investment advice (refer rating interpretation)
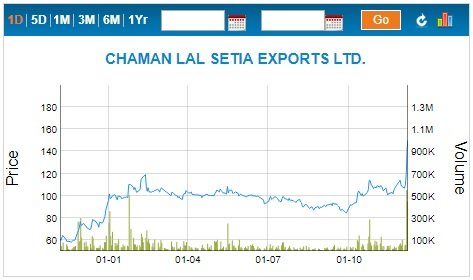
Chaman Lal Setia Nov’16-Dec’17 price chart Source: BSE India
Chaman Lal Setia has reported strong growth in sales for Sep’17 quarter at Rs 188.78 crore. The sales are up by more than 55% on YOY basis.
Among its peers, while KRBL has reported flattish sales, LT foods has reported 3% growth in sales on YOY basis.
On the front of raw materials the company has recorded gross margins of 16.65% against 32.31% in Sep’16 quarter. Chaman Lal’s gross margins tend to be very volatile on quarterly basis, and in this quarter other expenses have gone down by more than 50% despite 55% increase in sales, so most probably there has been some recategorization of expenses; however otherwise as well the gross margins seem to be tending towards long term average of 20%.
Both KRBL and LT Foods have witnessed improvement in gross margins on YOY basis and this might be because they carry a lot of old inventory for ageing purpose. Also, they command much higher margins of around 35% and 30% respectively as both have higher share of branded business, while Chaman Lal Setia is more into trading.
As mentioned above the other expenses are down by more than 50%, while the overall operating expenses are down by around 40%; however on account of 1566 bps dip in gross margins, the EBITDA of the company is up by only 10.27% at Rs 17.67 crore.
As the company was carrying lots of inventory at the end of Mar’17 quarter, its net debt had increased and as a result finance cost is higher. With higher finance and depreciation cost, the PBT of the company is almost flat at Rs 15.97 crore against Rs 15.88 crore in Sep’16 quarter.
Looking at the downtrend in gross margins, we believe Chaman Lal is failing to move up the value chain and increase the share of branded sales in overall business; however at the same time its focus seems to be on efficient working capital management because a lot of rice processors have gone bankrupt on failing to effectively manage working capital.
As the stock has recently shot up by around 50% (150% since initiation) and quoting at around 20 times earnings, we have a negative rating on the stock and also closing coverage on the same. We may re-look at the company at a later stage depending on how the business of the company shapes out.
Poddar Pigments (NSE – PODDARMENT) – Jan’17 Alpha stock
CMP – 294.60 (BSE); 291.20 (NSE)
Rating – Neutral; this is not an investment advice (refer rating interpretation)
Sales of the company for the Sep’17 quarter are down by 4.18% on YOY basis at Rs 78.73 crore. On the back of expansion in capacity, company’s competitor Plastiblends has reported 11% growth in sales.
Despite de-growth in sales, the company has done well in terms of gross margins as the same have improved to 25.99% against 22.98% in Sep’16 quarter. The company has been spending around Rs 4-5 crore annually on R&D and has been working on introduction of new colour and additive masterbatches. Further, there might be some impact of input tax credit getting reflected in raw material consumption. However, on the flip side, Plastiblends has reported contraction in margins of around 500 bps.
Company’s operating expenses are up by 12.45% on YOY basis; however on account of 301 bps expansion in gross margins the EBITDA of the company is up by 1.26% to Rs 6.93 crore with EBITDA margins of 8.80%
The company is a net interest earner and with slightly higher other income the PBT of the company for the Sep’17 quarter is up by 3.36% on YOY basis to Rs 7.42 crore
The operating performance and balance sheet of the company continues to be very strong; though growth in sales has been lacking since quite a few quarters now.
The stock is currently quoting around 15 times trailing twelve months earnings. The company holds around Rs 30-40 crore of surplus cash.
In case of Poddar Pigments, the capital requirement for expanding capacity doesn’t seem to be very high; however since some time now the company hasn’t been very aggressive in terms of capacity addition and running the plants close to optimum utilization. The company’s products are used in textiles and polymer products, so ideally in the long run there should be good demand and with Poddar’s balance sheet, it should be able to capitalize on the same.
However, as the stock has re-rated while the earnings have failed to match up, we have a neutral rating on the stock.
Control Print (NSE – CONTROLPR) – May’14 Alpha stock
CMP – 499.00 (BSE); 500.75 (NSE)
Rating – Neutral; this is not an investment advice (refer rating interpretation)
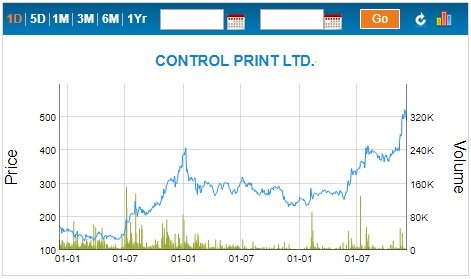
Control print 3 years price chart Source: BSE India
For the Sep’17 quarter, the company has reported 20.53% growth in sales on YOY basis to Rs 41.45 crore. The sales growth is good and in line with what the company has been reporting since last few quarters.
On the front of raw materials, the company has reported gross margins of 67.62% against 71.04% in Sep’16 quarter. Company’s gross margins tend to vary depending on product mix, with printers commanding lower margins than consumables.
Company’s operating expenses have increased by only 12.19% against 20% growth in sales and therefore despite lower gross margins, control print has reported 18.38% growth in EBITDA to Rs 11.78 crore with EBITDA margins of 28.42%
The company has restated its results as per IND-AS and on account of the same its depreciation cost has increased from the earlier reported figures of 0.8-0.9 crore for a quarter. With clubbing of printers on lease from inventory to fixed assets and restatement of fixed assets at fair value, the management expects depreciation cost to be around 1.8-1.9 crore for the quarter.
Last year’s depreciation cost has been restated with some adjustments; however assuming it to be around 1.8 crore against the restated figure of 4 crore, the company has reported 17.5% growth in PBT to Rs 9.72 crore.
Overall, company has been reporting strong set of numbers with decent growth in sales and maintenance of margins at around 26-27%. The balance sheet also looks in slightly better shape with working capital increasing only marginally since Sep’16. The management is hopeful of sustaining double digit growth rate in the range of 15-20% on the back of growth in overall market and expected gain in market share.
The stock is currently trading around 25-26 times earnings.
Disclosure: Out of the stocks discussed above, I have personal investment in Mazda and Control Print.
Best Regards,
Ekansh Mittal
Research Analyst
https://www.katalystwealth.com/
Ph.: +91-727-5050062, Mob: +91-9818866676
Email: [email protected]
Rating Interpretation
Positive – Expected return of ~15% + on annualized basis in medium to long term for investment recommendations and in short term for Special situations
Neutral – Expected Absolute return in the range of +/- 15%
Negative – Expected Absolute return of over -15%
Coverage closure – No further update on the stock
% weightage – allocation in the subject stock with respect to equity investments
Short term – Less than 1 year
Medium term – Greater than 1 year and less than 3 years
Long term – Greater than 3 years
Research Analyst Details
Name: Ekansh Mittal Email Id: [email protected] Ph: +91 727 5050062
Analyst ownership of the stock: In Mazda and Control Print
Details of Associates: Not Applicable
Analyst Certification: The Analyst certify (ies) that the views expressed herein accurately reflect his (their) personal view(s) about the subject security (ies) and issuer(s) and that no part of his (their) compensation was, is or will be directly or indirectly related to the specific recommendation(s) or views contained in this research report.
Disclaimer: www.katalystwealth.com (here in referred to as Katalyst Wealth) is the domain owned by Ekansh Mittal. Mr. Ekansh Mittal is the sole proprietor of Mittal Consulting and offers independent equity research services to retail clients on subscription basis. SEBI (Research Analyst) Regulations 2014, Registration No. INH100001690
Ekansh Mittal or its associates including its relatives/analyst do not hold beneficial ownership of more than 1% in the company covered by Analyst as of the last day of the month preceding the publication of the research report.
Ekansh Mittal or its associates/analyst has not received any compensation from the company/third party covered by Analyst ever.
Ekansh Mittal/Mittal Consulting/analyst has not served as an officer, director or employee of company covered by Analyst and has not been engaged in market-making activity of the company covered by Analyst.
We submit that no material disciplinary action has been taken on Ekansh Mittal by any regulatory authority impacting Equity Research Analysis.
The views expressed are based solely on information available publicly and believed to be true. Investors are advised to independently evaluate the market conditions/risks involved before making any investment decision
A graph of daily closing prices of securities is available at www.bseindia.com (Choose a company from the list on the browser and select the “three years” period in the price chart
This report is for the personal information of the authorized recipient and does not construe to be any investment, legal or taxation advice to you. Ekansh Mittal/Mittal Consulting/Katalyst Wealth is not soliciting any action based upon it. This report is not for public distribution and has been furnished to you solely for your information and should not be reproduced or redistributed to any other person in any form. This document is provided for assistance only and is not intended to be and must not alone be taken as the basis for an investment decision. Ekansh Mittal or any of its affiliates or employees shall not be in any way responsible for any loss or damage that may arise to any person from any inadvertent error in the information contained in this report. Neither Ekansh Mittal, nor its employees, agents nor representatives shall be liable for any damages whether direct or indirect, incidental, special or consequential including lost revenue or lost profits that may arise from or in connection with the use of the information. Ekansh Mittal/Mittal Consulting or any of its affiliates or employees do not provide, at any time, any express or implied warranty of any kind, regarding any matter pertaining to this report, including without limitation the implied warranties of merchantability, fitness for a particular purpose, and non-infringement.
The recipients of this report should rely on their own investigations. Ekansh Mittal/Mittal Consulting and/or its affiliates and/or employees may have interests/ positions, financial or otherwise in the securities mentioned in this report. Mittal Consulting has incorporated adequate disclosures in this document. This should, however, not be treated as endorsement of the views expressed in the report.