Dear Members,
We have released 26th Jan’19: Greenply Industries Ltd (NSE Code – GREENPLY) – Alpha/Alpha Plus stock for Jan’19. For details and other updates, please log into the website at the following link – https://katalystwealth.com/index.php/my-account/
Note: For any queries, mail us at [email protected]
Date: 26th Jan’19
CMP – 131.35 (BSE); 130.50 (NSE)
Rating – Positive – 4% weightage; this is not an investment advice (refer rating interpretation)
Introduction
Greenply is a wood-based products company engaged in the manufacturing of Plywood and allied products and Medium Density Fiberboards (MDF).
The company was incorporated in 1990 and since then it has set up 4 units for Plywood and 2 units for MDF.
As on date, we like several points about the company and they are as below:
Major correction in the stock price – Yes, the stock is down more than 60% from its recent highs. For a company like Green Ply which is one of the largest companies in India in the space of interior decoration, has a strong track record of operating performance, and considering other factors (as discussed below), we believe the recent correction offers a good opportunity to invest in the stock from the perspective of next 3-4 years.
New MDF plant commissioned – The Company has recently commissioned a new MDF plant with capacity 2x the capacity of its older plant. The total MDF capacity of the company has increased from 180,000 CBM to 540,000 CBM. While there are on-going issues in terms of supply outstripping demand, we believe it is already being discounted by the market and that’s why the stock is down more than 60% from its highs.
With new MDF plant already commissioned, the project execution/delay risk is also behind for the company.
Recovery in plywood segment – The plywood industry accounts for around 91% of the wood panel business in the country with a size of Rs 19,000 crore in FY 2018, though organised players account for only 25%. With rationalisation of GST from 28% to 18% on plywood and stricter implementation of e-way bill the organised industry players are hopeful of increasing their market share. The industry is estimated to post 11% CAGR and organised players are expected to clock a much higher growth rate over FY 2017-2022.
Signs of improvement in real-estate space – As per the report of Anarock Property Consultants Pvt. Ltd., in 2018, sales rose by 18% and new launches by 33% across the top seven cities compared to 2017. Further, Residential inventory overhang reduced to a year-low from 47 months in Q4 2017 to 33 months in Q4 2018 across the top seven cities.
Basic details
Green ply is a wood-based products company engaged in manufacturing of Plywood and allied products and Medium Density Fiberboards (MDF).
The company is one of the largest players in both Plywood and MDF segments. It commands ~26% share of the organized Plywood market and 22% share of the domestic MDF market.
The company has 4 state-of-the-art manufacturing facilities for Plywood and 2 facilities for MDF.
In Plywood segment, the company has a total capacity of around 35.40 million sq. Mt.; however it also outsources around 30% of its volume requirement from other vendors. In the MDF segment, the company had a total capacity of 180,000 cubic meter (CBM) till FY 18; however it recently commissioned a new plant in Jul’18 and with the same the capacity has increased to 540,000 CBM.
Green Ply’s brands like ‘Greenply’ & ‘Green Club’ in the plywood segment and ‘Greenpanel’ in the MDF segment are the one of the leading brands in their respective product categories. The company has also entered the lower segment of plywood through the outsourcing route with the introduction of two new brands ‘Bharosa’ and ‘Jansathi’ during FY18.
The company has a strong distribution network with 1,825 stockists/distributors and 7,000 retailers for the Plywood segment and 889 distributors and 4000 retailers for the MDF segment.
Overview of Plywood business
The overall size of the Plywood market in India is around 19,000 crore with Organized players like GreenPly accounting for only around 4,500 crore of the overall pie.

Source: Greenply Presentation
Of the total 19,000 crore market, it is divided into 3 major segments on the basis of price of plywood psf (per sq. ft.). Till now Greenply largely operated in Luxury/Premium segment; however it is now slowly increasing its presence in Medium/Mass market.
The luxury plywood market consists of products in the range of 100-140 psf. It is largely dominated by organized players that account for 70% of the segment and this segment reported strongest growth of 10-12% CAGR between FY 13-18.
However, off-late the growth has slowed down in the luxury segment and the medium/mass market is picking up pace. The Medium/mass market is the biggest in size and largely unorganized with organized to unorganized mix of 15:85. The products in the medium/mass market range between 70-90 psf.
Considering higher growth in medium/mass market, expected shift in mix towards organized players (with stricter implementation of GST and e-way bill) and large opportunity size, Green ply has launched 2 new brands ‘Bharosa’ and ‘Jansathi’ through the outsourcing route.
The company doesn’t compete in the low-end plywood segment; though it believes that MDF will take over the share of low-end plywood market in India.
Manufacturing facilities – Greenply has 35.4 mn sq. mt. of capacity spread across 4 manufacturing facilities.
It has been running its plants at more than 100% capacity utilization since the last few years and still managing some growth year-on-year on the back of increase in outsourcing model.
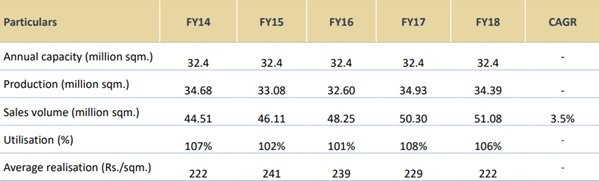
Source: Greenply Presentation
The company currently outsources 30% of its overall volume requirement and the same accounts for 22% of plywood sales in value terms. With increasing focus on Medium/mass brand, the management intends to increase the proportion of outsourcing to 30% over the next few years while continue manufacturing premium brands at its own facilities.
The company has also proposed a CAPEX of 55-60 crore for setting up Plywood plant in UP with capacity of 12-13 mn sq. mt.
Raw material security – Adequate availability of raw material is a key concern for plywood manufacturers. Typically, Core Veneer forms about 90% of the total wood required for Plywood while Face Veneer accounts for the balance 10%.
While face veneer is a high-quality premium timber usually derived from matured trees and largely imported, core timber is mainly sourced from the domestic market. Face Veneer derived from hardwoods like Myanmar Gurjan is the crucial value-add component with high aesthetic appeal and higher costs and is largely imported from countries like Myanmar, Laos etc.
Thus, securing a steady source for Face Veneer supply is a key competitive advantage for Plywood companies.
As a backward integration initiative, Greenply had set up a veneer plant in Myanmar and has already commenced operations of 36,000 cubic meter (CBM) of veneer unit in Gabon, West Africa through a step down subsidiary.
The management believes, that unlike Myanmar, Gabon has very sustainable forest policies and has embarked on the process of expanding the Gabon facility for peeling of logs from 36,000 CBM to 96,000 CBM by Q1 FY 20.
Overview of MDF business
The overall size of the MDF market in India is around 1,800 crore and almost entirely accounted for by few organized players like Greenply, Centruyply, Action Tesa, Rushil Decor, etc and imports.
India’s MDF market is highly under-penetrated with a consumption of just 0.8 million CBM against China’s 43 million CBM annually. Similarly India’s MDF production capacity is only around 1.3 million CBM against global MDF capacity of ~108 million CBM.
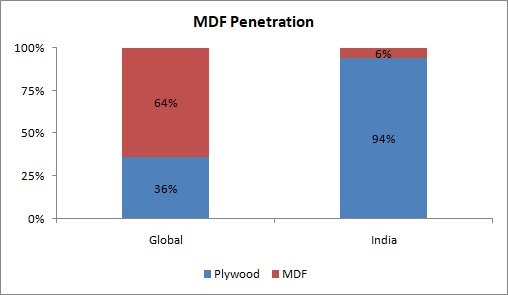
Source: Greenply Presentation
The low penetration of MDF in India can also be judged from the fact that Plywood still accounts for 94% of the wood based panels in India, while globally MDF accounts for the bulk share at 64%.
Going forward MDF demand is expected to grow at 15-20% CAGR on the back of substitution of low-end cheap plywood, transition of furniture industry from unorganized to organized, increasing use of ready-made furniture, etc.
Overcapacity in the industry – India’s MDF manufacturing capacity will be ~1.3 million CBM by mid 2019. It has increased from 0.52 million CBM in 2015.
Currently, Greenply has a capacity of 0.54 million CBM, Action Tesa’s capacity is around 0.51 million CBM and Centuryply’s capacity is around 1.98 million CBM.
At 1.3 million CBM it is still paltry in comparison to the global production capacity of 108 million and China’s capacity of 43 million; however the total demand for MDF in India is still low at around 0.8 million CBM.
Another concern for domestic MDF manufacturers is from imports, mainly from China. At present, imports account for nearly 30% of the demand. Since MDF is a bulky item its transportation involves considerable cost. Thus, imported products find ready market in the South which accounts for nearly 45% of the all India market.
Before Greenply’s 0.36 million CBM capacity came up in Andhra Pradesh, most of the Indian MDF manufacturing units were located in the Northern parts of the country and transporting to Southern markets wasn’t a very viable option because imported MDF costs around 18,000/CBM against Indian MDF sale value of 24,000-26,000/CBM.
Though the demand for MDF is growing at 15-18% (for the reasons discussed above), the excess capacity and imports are still high in comparison to the overall demand and with sudden influx of so much capacity the market has seen price war and reduction in realizations for most of the players.
To counter imports of MDF, Govt. has levied anti-dumping duty on the thick MDF, so there the price gap is about 8% to 10% and in the thin segment where there is no anti-dumping, currently the price gap is about 25%. It is believed that share of exports will reduce to around 20% by FY 21 from 30% in the last few years.
Overall, the excess capacity is likely to pose problems of lower utilization and realizations for the domestic players for at least the next 2 years; however as the demand is growing rapidly and with some of the capacities getting used up for exports, the situation should start normalizing 2 years from now.
It is also important to note here that as the capital cost of setting up a MDF plant is high (~500 crore for 0.2 million CBM capacity), the entire market is largely dominated by organized players and none of the existing players or new players are going to think of setting up a new plant for at least next 3 years or so and that should also result in demand supply situation normalizing.
Greenply’s position in the Industry – As mentioned above, out of 1.3 million CBM MDF capacity in India, Greenply has a bulk share at 0.54 million CBM.
The company has two plants for the same: 0.18 CBM plant in Pantnagar, Uttrakhand and the recently commissioned (Jul’18) 0.36 CBM plant in Andhra Pradesh (AP).
Before the capacity deluge in MDF space i.e. till FY 18, Greenply was running its Pantnagar MDF plant at more than 100% capacity utilization (since the last 2 years) with realizations of around 25,000-26,000/CBM and EBITDA margin of around 28%.
Performance Snapshot
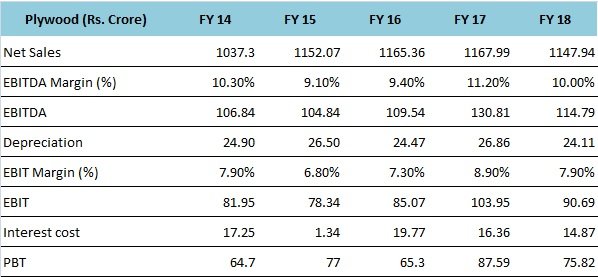
Source: Greenply’s ARs and Presentation
As can be seen from the above illustration, the performance of the Plywood division has been steady across the years, though the company could not grow much on account of several factors including de-monetization, GST implementation, RERA and overall slowdown in real-estate.
However, the growth has started to come back in the Plywood segment with the company reporting 14.8% growth in sales of Plywood in H1 FY 19 over H1 FY 18.

Source: Q2 FY 19 Greenply Presentation
For the plywood division, the management has charted out the growth plan as it is looking to expand the capacity by 12-13 million sq. mt. by setting up a plant in UP at a cost of around 55-60 crore. The plant would commence operations in FY 20. This will be a major expansion (in terms of volumes) and will be after a gap of several years.
Further, for enhancing its share in the medium/mass market the company has already launched two brands “Bharosa” and “Jansathi” and intends to outsource them from other vendors.
Considering the size of the Medium/mass market (9,700 cr. Vs 3,800 cr. for premium/luxury), the fact that it is largely unorganized at 85%, shift from unbranded to branded, improving state of affairs in the real estate space, we believe company might be able to maintain 8-10% annualized growth rate over the course of the next few years.
In one of the con-calls, the management indicated that they will be looking to achieve Rs 1,500-1,600 crore revenues and 11.0-11.5% EBITDA margins for the plywood business post de-merger (de-merger is expected in mid 2019).
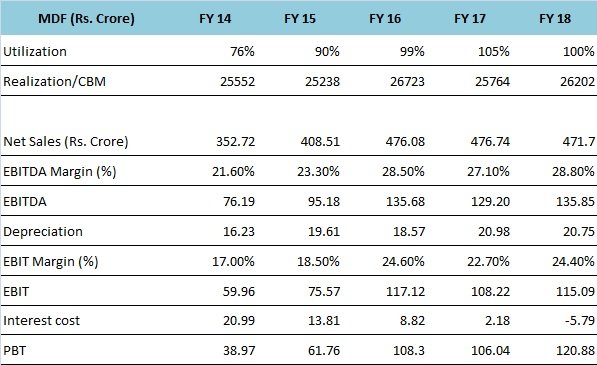
Source: Greenply’s ARs and Presentation
Coming to the performance of the MDF division, as can be noticed it has done really well over the years with the company consistently achieving 100% capacity utilization, 27-28% EBITDA margins and the unit (Pantnagar plant) even achieved debt-free status.
However, the performance of the MDF division in the last 2 quarters has been severally impacted on both the utilization and the realization fronts. The company commissioned AP plant in Jul’18 and at around the same time the country has seen commissioning of capacity from other major players as well.
As a result, Greenply witnessed pressure on both volumes of sales and realizations as well.
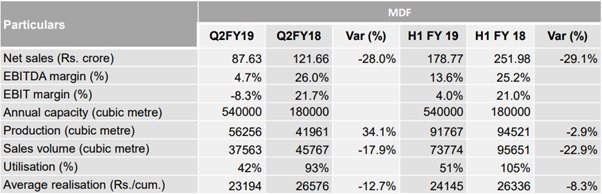
Source: Q2 FY 19 Greenply Presentation
Going forward, till the domestic demand picks up to match the supply, the company will be looking to ramp up the sales from the AP plant by doing a substantial volume of exports, though it is important to note here that realizations on exports are much lower at around 16,000-17,000/CBM against around 24,000/CBM for domestic sales.
Currently the demand for MDF in India is around 0.8 million CBM, while the capacity is ~1.3 million CBM and the imports are around 0.2 million CBM. The MDF demand in the country is expected to grow at 15-20% on annualized basis and no major capacity is expected to be commercialized in the foreseeable future.
As envisaged, if the demand maintains 15-20% growth over the next 3-4 years, then the entire domestic capacity will get utilized and the plants will attain 90-100% capacity utilization.
Greenply management is targeting blended (AP + Pantnagar) capacity utilization of ~60% by FY 20.
Not in the next 2 years, but we believe the company might achieve maximum capacity utilization in next 3-4 years with margins stabilizing around 20-23% and that will give boost to the profitability of MDF division.
Valuations
The stock is currently quoting at a market cap of 1600 crore.
The company has net debt of around 750 crore and out of the same around 550 crore pertains to the new MDF plant at AP.
In the last 1 year or so the stock has corrected from a high of 385 to around current levels of 130-135. Based on our calculations, as illustrated below, we believe the downside from the current levels is low and there could be decent upside (over the course of next 3-4 years) once the demand supply situation in the MDF space stabilizes.
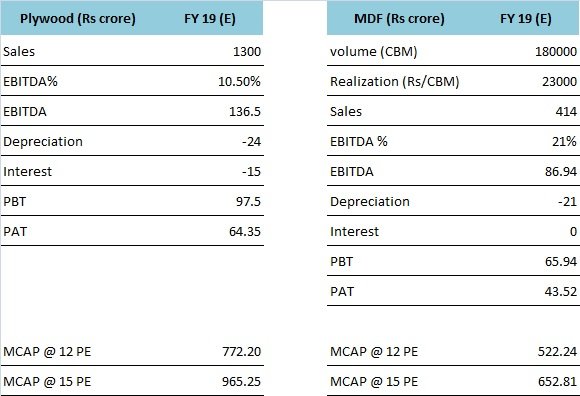
Firstly, ignoring the new MDF plant, we believe the operating metrics for Plywood and MDF (Pantnagar unit) units work out as below:
Source: Katalyst Wealth Research
For Plywood, the assumptions are simple because they are mostly in line with what the company has been reporting since the last few years and has reported in H1 FY 19.
As far as MDF (Pantnagar unit) is concerned, considering the drop in realizations (~24,000/CBM in the domestic market), we have assumed realizations of 23,000/CBM and EBITDA margins of 21% against ~29% recorded in FY 18.
At an exit multiple of 15 for both the businesses, the market cap works out as Rs 1,617 crore against current market cap of Rs 1,600 crore. At lower multiple of 12, the cumulative market cap works out as Rs 1,294 crore; however it is important to note here that we haven’t taken into account the MDF AP unit which has double the capacity of Pantnagar unit and is already up and running.
Below, we have also shared some projections for the Plywood business and the MDF business (both Pantnagar and AP) for FY 23.

Source: Katalyst Wealth Research
It is a well known fact that projections rarely come true because they get influenced by the prevailing situation; however please find below some of our assumptions:
For Plywood business
- 8.5% CAGR in sales over the next 4 years
- 6 crore increase in depreciation cost on account of proposed plywood unit in UP
- No major change in interest cost
- Normal tax rate
For MDF business
- 90% capacity utilization of the total capacity of 0.54 million CBM
- Two-third sales (volumes) from domestic market and remaining from exports
- 25,000/CBM in domestic market and 17,000/CBM from exports
- 34 crore increase in depreciation cost
- 25 crore increase in interest cost (For AP MDF plant, majorly the loans are in foreign currency with blended annual interest cost of 2%)
- While the management has indicated tax rate of 25% for the MDF business, we have assumed 28% tax rate
We have also indicated market cap of both the businesses at various exit multiples. It is important to note here that over the last 5 years or so Greenply has consistently traded in excess of multiple of 15.
Risks/concerns
Our investment thesis incorporates assumptions about normalization of demand supply gap in the MDF space in India; if the MDF demand doesn’t grow at the expected rate or if the new capacity comes in, the situation may not improve and the MDF business may continue to bleed.
Company has taken loans in Euro and USD currencies and has already incurred losses on account of depreciation of rupee against both.
Company is planning to separate MDF and Plywood businesses through de-merger and that might result in some uncertainty regarding distribution network, management, etc.
Disclosure: I do not have any holding in Greenply and have not traded in the stock in the last 30 days.
Best Regards,
Ekansh Mittal
Research Analyst
https://www.katalystwealth.com/
Ph.: +91-727-5050062, Mob: +91-9818866676
Email: [email protected]
Rating Interpretation
Positive – Expected return of ~15% + on annualized basis in medium to long term for investment recommendations and in short term for Special situations
Neutral – Expected Absolute return in the range of +/- 15%
Negative – Expected Absolute return of over -15%
Coverage closure – No further update on the stock
% weightage – allocation in the subject stock with respect to equity investments
Short term – Less than 1 year
Medium term – Greater than 1 year and less than 3 years
Long term – Greater than 3 years
Research Analyst Details
Name: Ekansh Mittal Email Id: [email protected] Ph: +91 727 5050062
Analyst ownership of the stock: No
Details of Associates: Not Applicable
Analyst Certification: The Analyst certify (ies) that the views expressed herein accurately reflect his (their) personal view(s) about the subject security (ies) and issuer(s) and that no part of his (their) compensation was, is or will be directly or indirectly related to the specific recommendation(s) or views contained in this research report.
Disclaimer: www.katalystwealth.com (here in referred to as Katalyst Wealth) is the domain owned by Ekansh Mittal. Mr. Ekansh Mittal is the sole proprietor of Mittal Consulting and offers independent equity research services to retail clients on subscription basis. SEBI (Research Analyst) Regulations 2014, Registration No. INH100001690
The views expressed are based solely on information available publicly and believed to be true. Investors are advised to independently evaluate the market conditions/risks involved before making any investment decision.
A graph of daily closing prices of securities is available at www.bseindia.com (Choose a company from the list on the browser and select the “three years” period in the price chart.
This report is for the personal information of the authorized recipient and does not construe to be any investment, legal or taxation advice to you. Ekansh Mittal/Mittal Consulting/Katalyst Wealth is not soliciting any action based upon it. This report is not for public distribution and has been furnished to you solely for your information and should not be reproduced or redistributed to any other person in any form. This document is provided for assistance only and is not intended to be and must not alone be taken as the basis for an investment decision. Ekansh Mittal or any of its affiliates or employees shall not be in any way responsible for any loss or damage that may arise to any person from any inadvertent error in the information contained in this report. Neither Ekansh Mittal, nor its employees, agents nor representatives shall be liable for any damages whether direct or indirect, incidental, special or consequential including lost revenue or lost profits that may arise from or in connection with the use of the information. Ekansh Mittal/Mittal Consulting or any of its affiliates or employees do not provide, at any time, any express or implied warranty of any kind, regarding any matter pertaining to this report, including without limitation the implied warranties of merchantability, fitness for a particular purpose, and non-infringement.
The recipients of this report should rely on their own investigations. Ekansh Mittal/Mittal Consulting and/or its affiliates and/or employees may have interests/ positions, financial or otherwise in the securities mentioned in this report. Mittal Consulting has incorporated adequate disclosures in this document. This should, however, not be treated as endorsement of the views expressed in the report.
We submit that no material disciplinary action has been taken on Ekansh Mittal by any regulatory authority impacting Equity Research Analysis.
Disclosure (SEBI RA Regulations)
Whether the research analyst or research entity or his associate or his relative has any financial interest in the subject company/companies and the nature of such financial interest – No
Whether the research analyst or research entity or his associates or his relatives have actual/beneficial ownership of 1% or more securities of the subject company (at the end of the month immediately preceding the date of publication of the research report or date of the public appearance) – No
Whether the research analyst or research entity or his associate or his relative has any other material conflict of interest at the time of publication of the research report or at the time of public appearance – No
Whether it or its associates have received any compensation from the subject company in the past twelve months – No
Whether it or its associates have managed or co-managed public offering of securities for the subject company in the past 12 months – No
Whether it or its associates have received any compensation for investment banking or merchant banking or brokerage services from the subject company in the past 12 months – No
Whether it or its associates have received any compensation for products or services other than investment banking or merchant banking or brokerage services from the subject company in the past 12 months – No
Whether the subject company is or was a client during twelve months preceding the date of distribution of the research report and the types of services provided – No
Whether the research analyst has served as an officer, director or employee of the subject company – No
Whether the research analyst or research entity has been engaged in market making activity for the subject company – No