Dear Members,
We have released 20th Nov’19: Greenpanel Industries Ltd (NSE Code – GREENPANEL) – Alpha/Alpha Plus stock for Nov’19. For details and other updates, please log into the website at the following link – https://katalystwealth.com/index.php/my-account/
Note: For any queries, mail us at [email protected]
Date: 20th Nov’19
CMP – 47.50 (BSE); 47.60 (NSE)
Rating – Positive – 3% weightage; this is not an investment advice (refer rating interpretation)
Introduction
We had initiated a report on Greenply Industries (NSE Code – GREENPLY) in Jan’19 around 130-131 odd levels with 4% weightage.
The company was going through the process of de-merger at that point of time with 12th Jul’19 as the ex-date.
In the interim, Greenpanel Industries (NSE – GREENPANEL) got de-merged from Greenply Industries and the stock got listed on exchanges on 23rd Oct’19.
Greenpanel shares have been allotted in the ratio of 1:1, i.e., say if you had bought 1000 shares of Greenply on or before 11th Jul’19, then you would have been allotted 1000 shares of Greenpanel Industries.
In Model portfolio, we had 1,400 shares of Greenply Industries and have accordingly added 1,400 shares of Greenpanel Industries.
We have already closed the coverage on Greenply Industries and since our initiation and closure prices were almost the same i.e. around 130, the Greenpanel shares are almost free of cost.
However, as the weightage in Greenpanel was low and as we believe there’s good scope for returns over the next 3-4 years, we have come out with an independent report on Greenpanel with higher weightage.
The investment thesis remains the same, with minor changes in estimates.
Basic details
Greenpanel was earlier part of Greenply Industries. In an arrangement between the Promoters, the MDF business and the Plywood unit at Uttarakhand were de-merged into Greenpanel and the company got listed on exchanges in Oct’19.
Headquartered in Kolkata (West Bengal), Greenpanel operates out of two manufacturing units – in Uttarakhand and Andhra Pradesh. The Company services pan-India demand through more than 1,100 dealers and 5000 + retailers.
In addition to MDF, the Company is also engaged in the production of plywood, decorative veneers, wood floors and doors.
Greenpanel houses the largest MDF capacity in India at 540,000 cubic meter (CBM) and it also has 10.5 million sq. meter (SQM) capacity for Plywood.

Source: Greenpanel Q2 FY 20 Presentation
The 3,60,000 CBM MDF plant is the largest in Asia and equipped with European machinery. The plant is spread across 200 acres and capable of accommodating successive capacity expansions.
While there’s excess capacity in India in MDF segment, the good thing is that major CAPEX is already behind, the demand has been growing at more than 15% YOY and it’s unlikely that any further capacity will come up in foreseeable future.
As per our estimates, the MDF capacity utilization of the company will ramp up and will reach 100% in next 2-3 years or so. At full utilization, we believe the company could be highly profitable.
As far as Plywood unit is concerned, as per the non-compete agreement with Greenply Promoters, the company won’t be expanding in Plywood segment and will primarily focus on increasing utilization in MDF segment.
Overview of MDF business
The overall size of the MDF market in India is around Rs 1,800 crore and almost entirely accounted for by few organized players like Greenpanel, Centruyply, Action Tesa, Rushil Decor, and imports.
The Rs 1,800 crore MDF market is expected to grow to Rs 2,500 crore by 2024.
India’s MDF market is highly under-penetrated with a consumption of just about 0.9 million CBM against China’s 43 million CBM annually. Similarly, India’s MDF production capacity is only around 1.3 million CBM against global MDF capacity of ~108 million CBM.
Source: Greenply Presentation
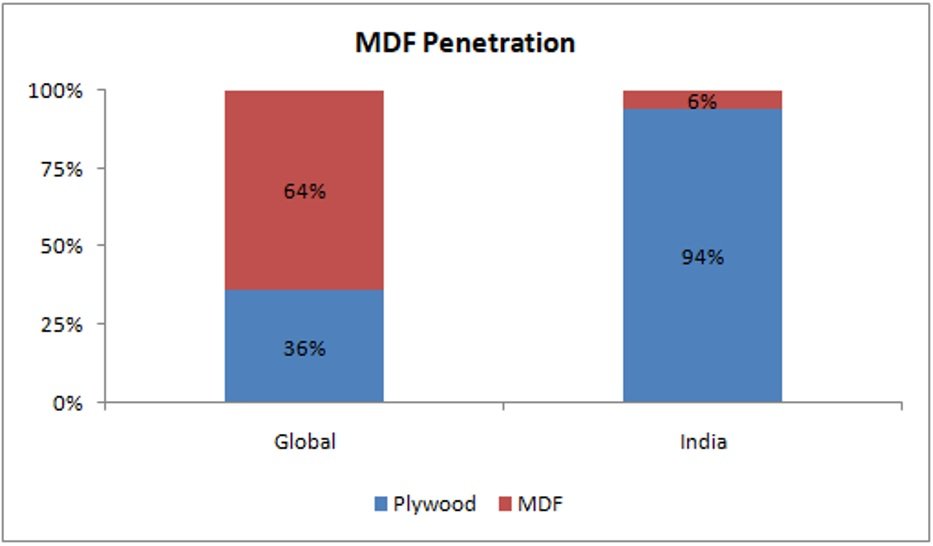
The low penetration of MDF in India can also be judged from the fact that Plywood still accounts for 94% of the wood-based panels in India, while globally MDF accounts for the bulk share at 64%.
Going forward MDF demand is expected to grow at 15-20% CAGR on the back of substitution of low-end cheap plywood, transition of furniture industry from unorganized to organized, increasing use of ready-made furniture, etc.
Overcapacity in the industry – India’s MDF manufacturing capacity will be ~1.54 million CBM by mid-2020. It has increased from 0.52 million CBM in 2015.
Currently, Greenply has a capacity of 0.54 million CBM, Action Tesa’s capacity is around 0.51 million CBM, Centuryply’s capacity is around 0.20 million CBM and Rushil’s is around 0.09 CBM. Rushil is setting up another plant with capacity of 0.20 million CBM and the same is likely to come up in 2020.
At 1.54 million CBM it will still be paltry in comparison to the global production capacity of 108 million and China’s capacity of 43 million; however, the total demand for MDF in India is still low at around 0.9 million CBM.
Another concern for domestic MDF manufacturers is from imports, mainly from China. At present, imports account for nearly 30% of the demand. Since MDF is a bulky item, its transportation involves considerable cost. Thus, imported products find ready market in the South which accounts for nearly 45% of the all India market.
Before Greenply’s 0.36 million CBM capacity came up in Andhra Pradesh, most of the Indian MDF manufacturing units were located in the Northern parts of the country and transporting to Southern markets wasn’t a very viable option because imported MDF costs around 18,000/CBM against Indian MDF sale value of 23,000-24,000/CBM.
Though the demand for MDF is growing at 15-18% (for the reasons discussed above), the excess capacity and imports are still high in comparison to the overall demand and with sudden influx of so much capacity the market has seen price war and reduction in realizations for most of the players.
To counter imports of MDF, Govt. has levied anti-dumping duty on the thick MDF, so there the price gap is about 8% to 10% and in the thin segment where there is no anti-dumping, currently the price gap is about 25%.
Companies including Greenpanel have provided further data to the Govt. for investigation into anti-dumping against 5 other Asian countries. Govt. has notified commencement of investigation and the decision regarding anti-dumping duty is likely to be announced in FY 20 itself.
Overall, the excess capacity is likely to pose problems of lower utilization and realizations for the domestic players for at least the next 2 years; however, as the demand is growing rapidly and with some of the capacities getting used up for exports, the situation should start normalizing 2 years from now.
It is also important to note here that as the capital cost of setting up a MDF plant is high (~400 crore for 0.2 million CBM capacity), the entire market is largely dominated by organized players and none of the existing players or new players are going to think of setting up a new plant for at least next 3 years or so and that should also result in demand supply situation normalizing.
Greenpanel’s position in the Industry – As mentioned above, out of 1.3 million CBM MDF capacity in India, Greenpanel has a bulk share at 0.54 million CBM.
The company has two plants for the same: 0.18 CBM plant in Pantnagar, Uttrakhand and the recently commissioned (Jul’18) 0.36 CBM plant in Andhra Pradesh (AP).
Before the capacity deluge in MDF space i.e. till FY 18, Greenpanel (erstwhile Greenply) was running its Pantnagar MDF plant at more than 100% capacity utilization with realizations of around 25,000-26,000/CBM and EBITDA margin of around 28%.
Since then, because of over-capacity, the realizations have dipped to around 20,000/CBM and as the utilization levels are also low, the EBITDA margins have fallen below 20%.
Performance Snapshot
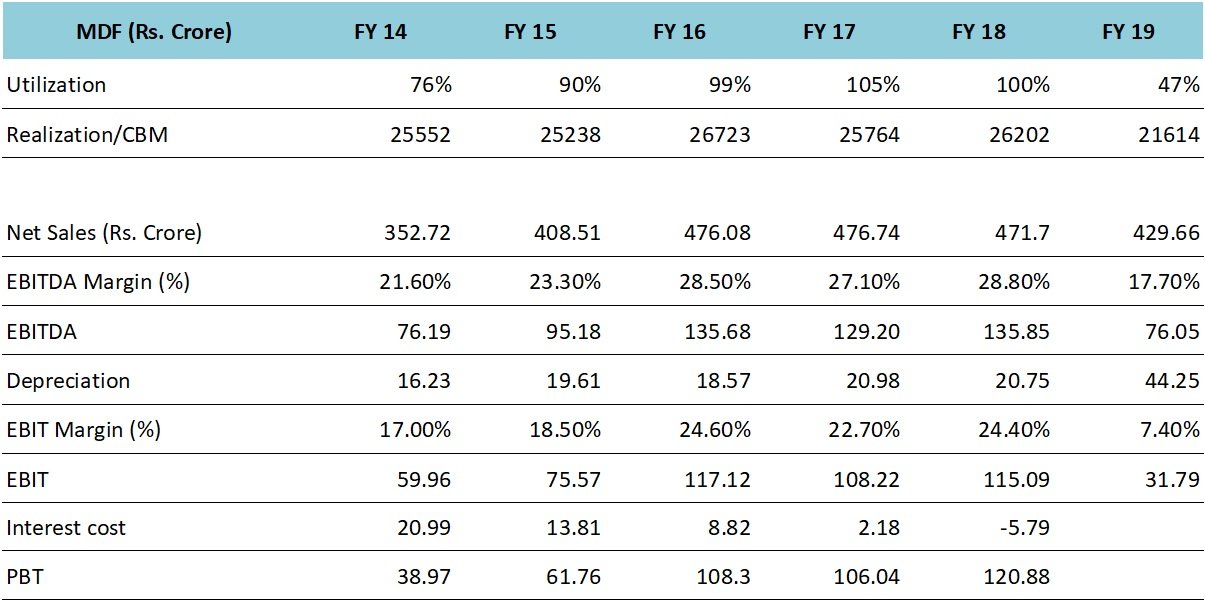
Source: Greenply’s ARs and Presentation
The above performance snapshot corresponds to MDF division performance of Greenply Industries, before the de-merger.
As can be noticed from the performance snapshot, the MDF division was performing well till FY 18 with 100% capacity utilization, 27-28% EBITDA margins and the Pantnagar unit achieved debt-free status.
However, the performance plummeted in FY 19 on both the utilization and the realization fronts. The company commissioned AP plant in Jul’18 and at around the same time the country witnessed commissioning of MDF plants from other major players as well.
As a result, Greenpanel witnessed pressure on both volumes of sales and realizations as well.

Source: Q2 FY 20 Greenpanel’s Presentation
Going forward, till the domestic demand picks up to match the supply, the company will be looking to ramp up the sales from the AP plant by doing a substantial volume of exports, though it is important to note here that realizations on exports are much lower at around 12,000-13,000/CBM against around 23,000/CBM for domestic sales.
For instance, in Q2 FY 20, the company achieved sales volume of 62,561 CBM. Out of the same, exports accounted for 16,490 CBM at Rs 12,285 per CBM and domestic sales accounted for 46,071 CBM at Rs 23,147 per CBM.
Interestingly, despite much lower utilization levels and realizations, the company could still achieve 19.6% EBITDA margins in Q2 FY 20.
As per the management, in order to boost the margins, they have been undertaking activities to reduce raw material and power cost and will be taking further steps to optimize resin consumption.
As envisaged, if the MDF demand clocks 15-20% CAGR over the next 3-4 years, then the demand supply imbalance will normalize and the plants will attain 80-100% capacity utilization.
Greenply management is targeting blended (AP + Pantnagar) capacity utilization of ~100% by FY 22. They are hoping to achieve the same on the back of both exports and domestic sales.
If not by FY 22, we believe the company should be able to achieve maximum capacity utilization in next 3 years with margins stabilizing around 20-23% and that will give boost to the profitability of MDF division.
Valuations
The stock is currently quoting at a market cap of 590 crore.
The company has net debt of 550 crore with blended cost of around 5.5%.
Based on our calculations, as illustrated below, we believe the downside from the current levels is low and there could be decent upside (over the course of next 3-4 years) once the demand supply situation in the MDF space stabilizes.
Below, we have shared some projections for the Plywood business and the MDF business (both Pantnagar and AP) for FY 23.
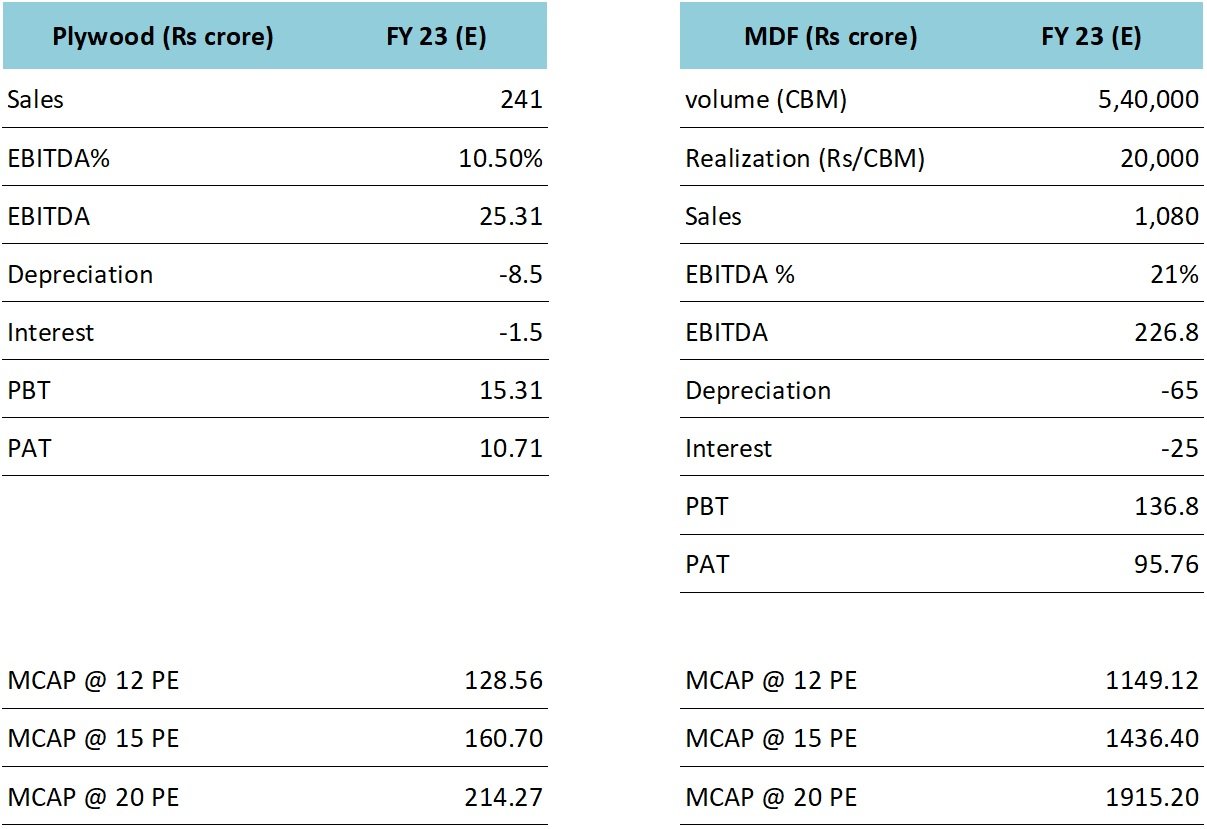
Source: Katalyst Wealth Research
It is a well-known fact that projections rarely come true because they get influenced by the prevailing situation; however please find below some of our assumptions:
For Plywood business
- 100% capacity utilization by FY 23 (81% achieved in H1 FY 20)
- Realization – Rs 230 per SQM (Rs 246 per SQM achieved in H1 FY 20)
- EBITDA margins – 10.5% (14.1% achieved in H1 FY 20)
- 30% tax rate (including 12.5% deferred tax)
Our assumptions may seem conservative considering the numbers achieved by the company in H1 FY 20; however, we have based our estimates on Greenply’s Plywood business performance over the last few years.
For MDF business
- 100% capacity utilization of the total capacity of 0.54 million CBM (management targeting 100% utilization by FY 22)
- 70% sales (volumes) from domestic market and remaining from exports
- 23,000/CBM in domestic market and 13,000/CBM from exports
- 21% EBITDA margins (management is targeting 22% by FY 22)
- 30% tax rate (including 12.5% deferred tax)
We have also indicated market cap of both the businesses at various exit multiples.
While the actual numbers could vary significantly from our projections, we believe our estimates are rather conservative and there’s reasonable probability of company’s performance surprising us on the upside.
Risks/concerns
Our investment thesis incorporates assumptions about normalization of demand supply gap in the MDF space in India; if the MDF demand doesn’t grow at the expected rate or if the new capacity comes in, the situation may not improve and the MDF business may continue to bleed.
Company has taken loans in Euro and USD currencies and has already incurred losses on account of depreciation of rupee against both.
We have assumed exit multiples in the range of 12-20. In case the market attributes lower valuations to the business, the returns will fall flat.
Disclosure: I have personal investment in Greenpanel Industries and have not traded in the stock in the last 30 days.
Best Regards,
Ekansh Mittal
Research Analyst
https://www.katalystwealth.com/
Ph.: +91-727-5050062, Mob: +91-9818866676
Email: [email protected]
Rating Interpretation
Positive – Expected return of ~15% + on annualized basis in medium to long term for investment recommendations and in short term for Special situations
Neutral – Expected Absolute return in the range of +/- 15%
Negative – Expected Absolute return of over -15%
Coverage closure – No further update on the stock
% weightage – allocation in the subject stock with respect to equity investments
Short term – Less than 1 year
Medium term – Greater than 1 year and less than 3 years
Long term – Greater than 3 years
Research Analyst Details
Name: Ekansh Mittal Email Id: [email protected] Ph: +91 727 5050062
Analyst ownership of the stock: Yes
Details of Associates: Not Applicable
Analyst Certification: The Analyst certify (ies) that the views expressed herein accurately reflect his (their) personal view(s) about the subject security (ies) and issuer(s) and that no part of his (their) compensation was, is or will be directly or indirectly related to the specific recommendation(s) or views contained in this research report.
Disclaimer: www.katalystwealth.com (here in referred to as Katalyst Wealth) is the domain owned by Ekansh Mittal. Mr. Ekansh Mittal is the sole proprietor of Mittal Consulting and offers independent equity research services to retail clients on subscription basis. SEBI (Research Analyst) Regulations 2014, Registration No. INH100001690
The views expressed are based solely on information available publicly and believed to be true. Investors are advised to independently evaluate the market conditions/risks involved before making any investment decision.
A graph of daily closing prices of securities is available at www.bseindia.com (Choose a company from the list on the browser and select the “three years” period in the price chart.
This report is for the personal information of the authorized recipient and does not construe to be any investment, legal or taxation advice to you. Ekansh Mittal/Mittal Consulting/Katalyst Wealth is not soliciting any action based upon it. This report is not for public distribution and has been furnished to you solely for your information and should not be reproduced or redistributed to any other person in any form. This document is provided for assistance only and is not intended to be and must not alone be taken as the basis for an investment decision. Ekansh Mittal or any of its affiliates or employees shall not be in any way responsible for any loss or damage that may arise to any person from any inadvertent error in the information contained in this report. Neither Ekansh Mittal, nor its employees, agents nor representatives shall be liable for any damages whether direct or indirect, incidental, special or consequential including lost revenue or lost profits that may arise from or in connection with the use of the information. Ekansh Mittal/Mittal Consulting or any of its affiliates or employees do not provide, at any time, any express or implied warranty of any kind, regarding any matter pertaining to this report, including without limitation the implied warranties of merchantability, fitness for a particular purpose, and non-infringement.
The recipients of this report should rely on their own investigations. Ekansh Mittal/Mittal Consulting and/or its affiliates and/or employees may have interests/ positions, financial or otherwise in the securities mentioned in this report. Mittal Consulting has incorporated adequate disclosures in this document. This should, however, not be treated as endorsement of the views expressed in the report.
We submit that no material disciplinary action has been taken on Ekansh Mittal by any regulatory authority impacting Equity Research Analysis.
Disclosure (SEBI RA Regulations)
Whether the research analyst or research entity or his associate or his relative has any financial interest in the subject company/companies and the nature of such financial interest – Yes
Whether the research analyst or research entity or his associates or his relatives have actual/beneficial ownership of 1% or more securities of the subject company (at the end of the month immediately preceding the date of publication of the research report or date of the public appearance) – No
Whether the research analyst or research entity or his associate or his relative has any other material conflict of interest at the time of publication of the research report or at the time of public appearance – No
Whether it or its associates have received any compensation from the subject company in the past twelve months – No
Whether it or its associates have managed or co-managed public offering of securities for the subject company in the past 12 months – No
Whether it or its associates have received any compensation for investment banking or merchant banking or brokerage services from the subject company in the past 12 months – No
Whether it or its associates have received any compensation for products or services other than investment banking or merchant banking or brokerage services from the subject company in the past 12 months – No
Whether the subject company is or was a client during twelve months preceding the date of distribution of the research report and the types of services provided – No
Whether the research analyst has served as an officer, director or employee of the subject company – No
Whether the research analyst or research entity has been engaged in market making activity for the subject company – No