Dear Members,
We have released 21st Aug’20 – Jun’20 earnings update on Chaman Lal Setia and Suven Pharmaceuticals. The same has been produced below. For other updates, please refer the following link – https://katalystwealth.com/category/latest-updates/
Date: 21st Aug’20
Chaman Lal Setia (BSE – 530307) – Sep’19 Alpha stock
CMP – 99.85 (BSE)
Rating – Positive – 4% weightage; this is not an investment advice (refer rating interpretation)
Source: bseindia.com
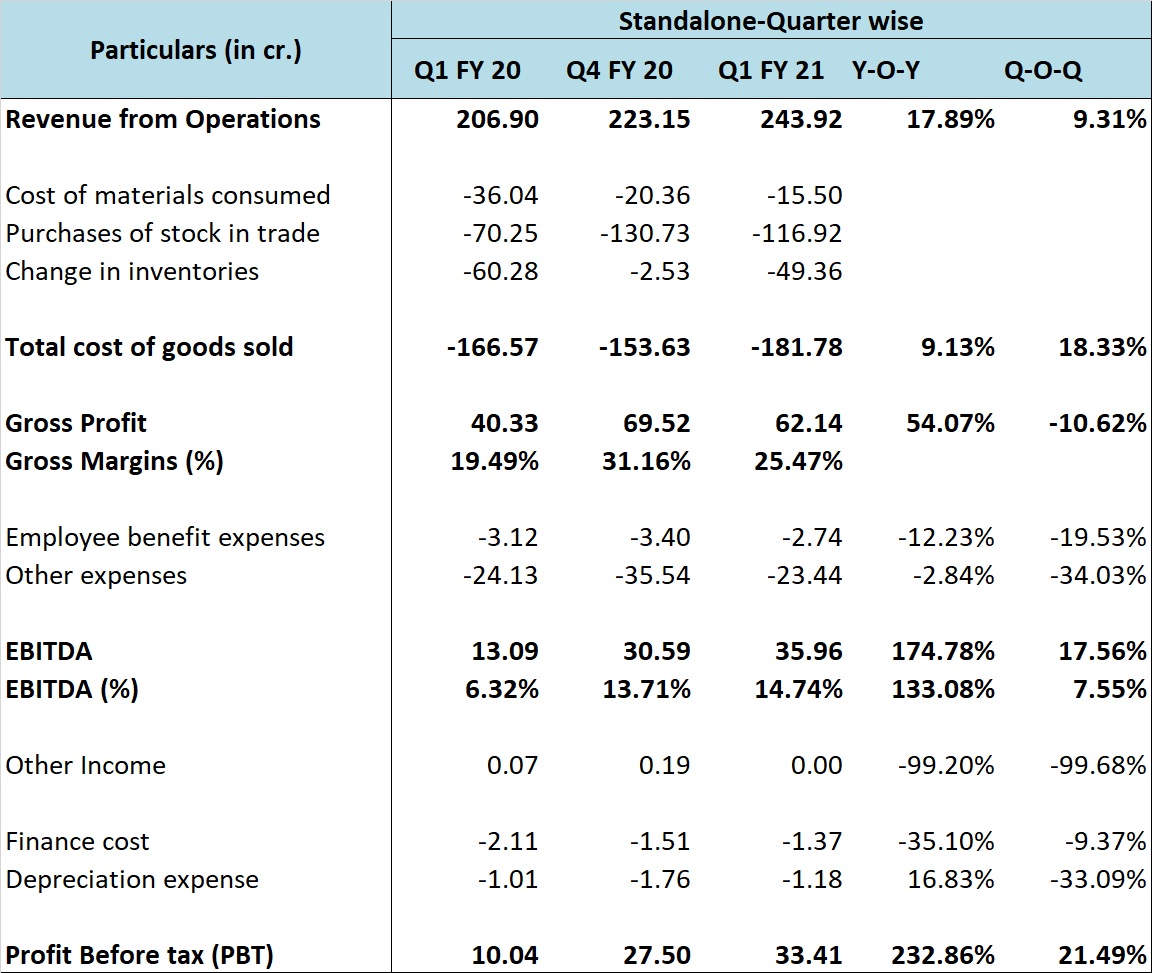
Chaman Lal has reported good set of numbers for the quarter ending Jun’20.
On YOY basis the company has reported 17.89% growth in sales to Rs 243.92 crore. The same has been achieved on the back of around 40% growth in volumes to 328,592 tons in Q1 FY 21 against 234,253 tons in Q1 FY 20.
As the basmati prices have contracted by 18-20% in the last 1 year, the value growth is lower than volume growth.
As per the management, except for the initial 10-15 days complete lockdown in the month of April, the transportation and shipments resumed thereafter and they didn’t face significant issues in conducting the business.
On the front of profitability, the gross margins of the company have shown an improvement of 598 bps to 25.47% and as a result the gross profits are up by 54.07%.
The management was quite upfront during the con-call and explained quite well that ultimately, it’s a commodity business and commodities tend to be volatile by nature. So, whenever the prices at the point of procurement are lower, the company tends to do well in terms of margins and profitability.
The model followed by the company is that of smaller consignments, multiple buyers and multiple countries (around 394 buyers in 90 countries). So, being a wholesale buyer, if the procurement prices come down, they can buy immediately and don’t have to pass on much of the same to their buyers; however, if the prices shoot up substantially, they are not able to raise immediately and do it with a lag.
So, normally, when the paddy and the rice prices go up, the margins in general tend to go down and that was the largely the case in the first 8-9 months of CY 2019.
Currently, the procurement prices are on the lower side and with Punjab recording highest area of cultivation this year, the prices are unlikely to move up much higher. So, company is likely to maintain gross margins of around 25% +/- for the next few quarters.
Company’s other operating expenses tend to vary a lot on quarterly basis and therefore annual numbers give a true reflection of the overall expenses. Nevertheless, on account of lower operating expenses in comparison to Q1 FY 20, the company has reported 175% growth in EBITDA to Rs 35.96 crore with EBITDA margins of 14.74%
We believe the current level of growth in profitability and EBITDA margins isn’t sustainable in the very long run. While the company might be able to sustain 25% + gross margins, some of the expenses that it probably didn’t have to incur in Q1 FY 21 will start coming back. Also, the base effect will start kicking in from Q3 FY 21.
Over more than a decade, the EBITDA margins of the company have sustained between 7-8% on the lower side and 12-13% on the higher end and unless something drastically changes in the business, we see the trend maintaining and don’t think 13-15% EBIDTA margins can be maintained by the company for very long.
On the front of balance sheet, the company repaid around Rs 38 crore of borrowings in FY 20 and thus incurred lower finance cost in Q1 FY 21.
Our assessment:
For companies like Chaman Lal, sales growth and margins have somewhat inverse relationship. When the paddy and the rice prices go up substantially, the growth in sales tends to be higher; however, the margins also contract in general at the same time.
As mentioned above, currently the margins are on the higher side. The procurement cost of paddy is expected to be lower and we therefore expect the company to continue reporting good performance for the remaining quarters of FY 21.
The balance sheet of the company continues to be good with not much leverage and CLSE looks well placed to capitalize on the long-term growth opportunities both domestically and on the front of exports.
The valuations also look reasonable at around 7-7.5 times trailing twelve months earnings and the margins look sustainable for the time being; however, we will remain cognizant of the fact that the business is still cyclical and as a profit protection strategy may consider exiting the stock in case of a fall below 80 odd levels.
Suven Pharmaceuticals (NSE – SUVENPHAR) – May’17 Alpha stock
CMP – 675.05 (BSE); 677.85 (NSE)
Rating – Positive – 5% weightage; this is not an investment advice (refer rating interpretation)
Source: bseindia.com
Suven Pharmaceuticals got demerged from Suven Lifesciences with the entire revenue generating businesses consisting of CRAMS, Specialty Chemicals and Formulations and Technical Services coming to Suven Pharma.
As we were covering Suven Lifesciences before the ex-date, all those who had invested in Suven Lifesciences on or before 20th Jan’20 must have been allotted the same number of shares of Suven Pharmaceuticals as they had of Suven Life.
You can read more about the demerger update at the following LINK
Further, we closed Suven Lifesciences in Mar’20 around 50 odd levels while continue to hold Suven Pharmaceuticals.
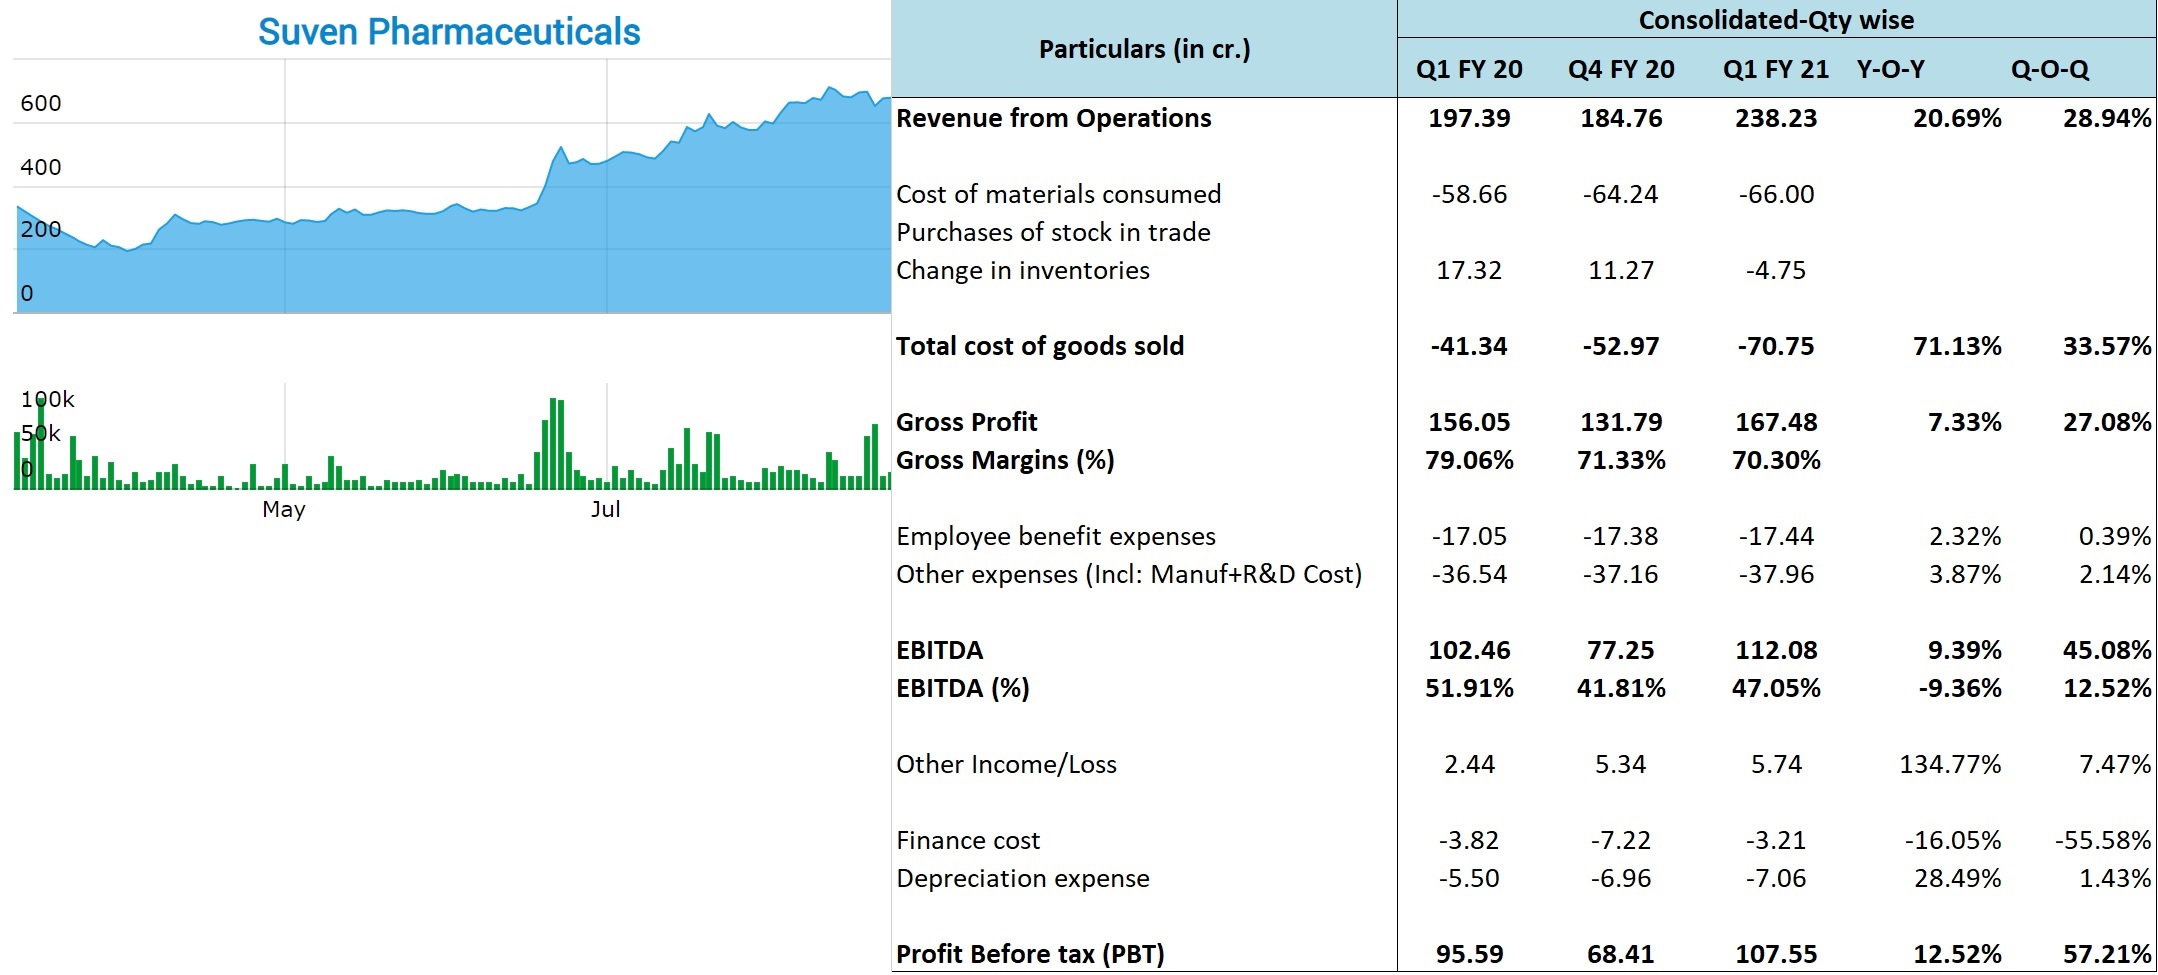
Coming back to results, Suven’s Performance tends to be lumpy as the sales depend on orders from its clients for various CRAMS molecules and Specialty molecules. Thus, full year results lend a much better picture of the performance of the company.
Still, for Q1 FY 21, the company has reported 20.69% growth in sales on YOY basis. The same has been achieved on the back of 39% growth in CRAMS sales to Rs 127.6 crore, 3.5% drop in Specialty Chemical sales to Rs 97 crore and Rs 13.6 crore sales from Formulations and Contract Technical Services (CTS).
Last year in Q1 FY 20 the product mix was extremely good and as a result the company had recorded 79.06% gross margins. In general, the gross margins of the company hover around 70-75% and in Q1 FY 21 as well the company has recorded gross margins of 70.30%.
Due to 876 bps contraction in gross margins, the gross profits are up by only 7.33% on YOY basis.
The company has exercised good control on operating expenses; however, there’s an impact of contraction in gross margins with the EBITDA margins down to 47.06% against 51.91% in Q1 FY 20.
With the demerger the NCE business is now in Suven Life and therefore there’s no major R&D expense in Suven Pharma.
The company is carrying some debt as liabilities towards Suven Life and will pay off the same in 2-3 years. The outstanding liability towards Suven Life is around Rs 115 crore at the end of Jun’20.
On the Standalone basis the company has reported PBT of Rs 107.58 crore which is higher by 12.09% on YOY basis while on the consolidated basis it has also reported Rs 10.32 crore profit as its share of 25% investment in Rising Pharma.
Overall, the company has reported flattish PAT of Rs 91.52 crore including share of profits in Rising Pharma.
Other Important Updates:
- As per the management, on Standalone basis, for FY 21 they are expecting 10-15% growth in topline and 20% growth in PAT
- The profit share from the Rising Pharma JV can range between Rs 40 crore and Rs 60 crore in FY21. The same was Rs 48 crore in FY 20.
- The company hasn’t lost any molecule in clinical trials in CRAMS; however, the new project flows has been hit and the recovery is expected only from Q3 FY 21.
- In Specialty, currently 2 molecules stand commercialized including 1 commercialized around a year back. Management is confident of adding one more specialty chemical molecule in FY21 and another one in FY 22. At full scale of commercialization, each can deliver sales of around Rs 50 crore.
- Formulations – There lies great potential in Formulations business. The company currently has 11 ANDAs filed in US (two from Rising Pharma) and has five molecules under development to be filed within 12-18 months.
- The ANDAs the company has been filing are for generic products with small volumes and not much competition.
- As per the management, each product has the potential to generate around USD 2-4 million in profits for the company.
- The company has so far launched two products and plans to add one more in FY21. In FY22 it plans to launch 3-4 products.
- The share of profit of formulation products supplied in Q1 is expected to come in Q2.
- For the formulations business, the growth in topline may not be significant, but the profit contribution can be much higher. Basically, the company will be selling the molecule on cost + basis to its distribution partner and will then have 25-50% share in profits for each molecule. Thus, the management is hopeful of USD 2-4 million in profits from each molecule.
- In fact, the management believes that profits from formulations business can be similar to CRAMS business in 2-3 years.
Our assessment
Suven Pharma is currently trading around 8,600 crore market cap. On TTM basis, the company has recorded standalone PAT of Rs 276 crore and consolidated PAT of Rs 317 crore.
Over the last 2-3 years the company has made substantial investments in upgrading plants and creating new capacities for CRAMS and Formulations business.
In the CRAMS business, the company is trying to graduate to supply of APIs from Intermediates and that could give a boost to sales and profitability in the years to come.
Similarly, in Specialty Chemicals, the expected commercialization of 2 more molecules should help sustain the current run rate.
However, what could really drive the growth in PAT is the formulations business. Given the management’s estimates of USD 2-4 million profits from each formulation’s molecule, the business can add ~150 crore PAT or even more over the course of next 3 years.
Thus, considering diversification of revenue base, lower lumpiness and prospects of 15-20% CAGR in profitability over the next 2-4 years, we believe the valuations of ~25-27 times earnings are sustainable and therefore have a positive rating on the stock.
Disclosure: Out of the stocks mentioned above, I have personal investment in Suven Pharmaceuticals.
Best Regards,
Ekansh Mittal
Research Analyst
https://www.katalystwealth.com/
Ph.: +91-727-5050062, Mob: +91-9818866676
Email: [email protected]
Rating Interpretation
Positive – Expected return of ~15% + on annualized basis in medium to long term for investment recommendations and in short term for Special situations
Neutral – Expected Absolute return in the range of +/- 15%
Negative – Expected Absolute return of over -15%
Coverage closure – No further update on the stock
% weightage – allocation in the subject stock with respect to equity investments
Short term – Less than 1 year
Medium term – Greater than 1 year and less than 3 years
Long term – Greater than 3 years
Research Analyst Details
Name: Ekansh Mittal Email Id: [email protected] Ph: +91 727 5050062
Analyst ownership of the stock: In Suven Pharmaceuticals
Details of Associates: Not Applicable
Analyst Certification: The Analyst certify (ies) that the views expressed herein accurately reflect his (their) personal view(s) about the subject security (ies) and issuer(s) and that no part of his (their) compensation was, is or will be directly or indirectly related to the specific recommendation(s) or views contained in this research report.
Disclaimer: www.katalystwealth.com (here in referred to as Katalyst Wealth) is the domain owned by Ekansh Mittal. Mr. Ekansh Mittal is the sole proprietor of Mittal Consulting and offers independent equity research services to retail clients on subscription basis. SEBI (Research Analyst) Regulations 2014, Registration No. INH100001690
The views expressed are based solely on information available publicly and believed to be true. Investors are advised to independently evaluate the market conditions/risks involved before making any investment decision
A graph of daily closing prices of securities is available at www.bseindia.com (Choose a company from the list on the browser and select the “three years” period in the price chart
This report is for the personal information of the authorized recipient and does not construe to be any investment, legal or taxation advice to you. Ekansh Mittal/Mittal Consulting/Katalyst Wealth is not soliciting any action based upon it. This report is not for public distribution and has been furnished to you solely for your information and should not be reproduced or redistributed to any other person in any form. This document is provided for assistance only and is not intended to be and must not alone be taken as the basis for an investment decision. Ekansh Mittal or any of its affiliates or employees shall not be in any way responsible for any loss or damage that may arise to any person from any inadvertent error in the information contained in this report. Neither Ekansh Mittal, nor its employees, agents nor representatives shall be liable for any damages whether direct or indirect, incidental, special or consequential including lost revenue or lost profits that may arise from or in connection with the use of the information. Ekansh Mittal/Mittal Consulting or any of its affiliates or employees do not provide, at any time, any express or implied warranty of any kind, regarding any matter pertaining to this report, including without limitation the implied warranties of merchantability, fitness for a particular purpose, and non-infringement.
The recipients of this report should rely on their own investigations. Ekansh Mittal/Mittal Consulting and/or its affiliates and/or employees may have interests/ positions, financial or otherwise in the securities mentioned in this report. Mittal Consulting has incorporated adequate disclosures in this document. This should, however, not be treated as endorsement of the views expressed in the report.
We submit that no material disciplinary action has been taken on Ekansh Mittal by any regulatory authority impacting Equity Research Analysis.
Disclosure (SEBI RA Regulations)
Whether the research analyst or research entity or his associate or his relative has any financial interest in the subject company/companies and the nature of such financial interest – Yes, investment in Suven Pharmaceuticals.
Whether the research analyst or research entity or his associates or his relatives have actual/beneficial ownership of 1% or more securities of the subject company (at the end of the month immediately preceding the date of publication of the research report or date of the public appearance) – No
Whether the research analyst or research entity or his associate or his relative has any other material conflict of interest at the time of publication of the research report or at the time of public appearance – No
Whether it or its associates have received any compensation from the subject company in the past twelve months – No
Whether it or its associates have managed or co-managed public offering of securities for the subject company in the past 12 months – No
Whether it or its associates have received any compensation for investment banking or merchant banking or brokerage services from the subject company in the past 12 months – No
Whether it or its associates have received any compensation for products or services other than investment banking or merchant banking or brokerage services from the subject company in the past 12 months – No
Whether the subject company is or was a client during twelve months preceding the date of distribution of the research report and the types of services provided – No
Whether the research analyst has served as an officer, director or employee of the subject company – No
Whether the research analyst or research entity has been engaged in market making activity for the subject company – No