Dear Members,
We have released 6th Nov’20 – Sep’20 earnings update on Suven Pharmaceuticals and Can Fin Homes. For other updates, please refer the following link – https://katalystwealth.com/category/latest-updates/
Date: 6th Nov’20
Suven Pharmaceuticals (NSE – SUVENPHAR) – May’17 Alpha stock
CMP – 325.75 (BSE); 326.60 (NSE)
Rating – Positive – 5% weightage; this is not an investment advice (refer rating interpretation)
Source: bseindia.com
Suven Pharmaceuticals got demerged from Suven Lifesciences with the entire revenue generating businesses consisting of CRAMS, Specialty Chemicals and Formulations and Technical Services coming to Suven Pharma.
As we were covering Suven Lifesciences before the ex-date, all those who had invested in Suven Lifesciences on or before 20th Jan’20 got allotted the same number of shares of Suven Pharmaceuticals as they had of Suven Life.
You can read more about the demerger update at the following (opens in new tab)LINK
Further, we closed Suven Lifesciences in Mar’20 around 50 odd levels while continue to hold Suven Pharmaceuticals.
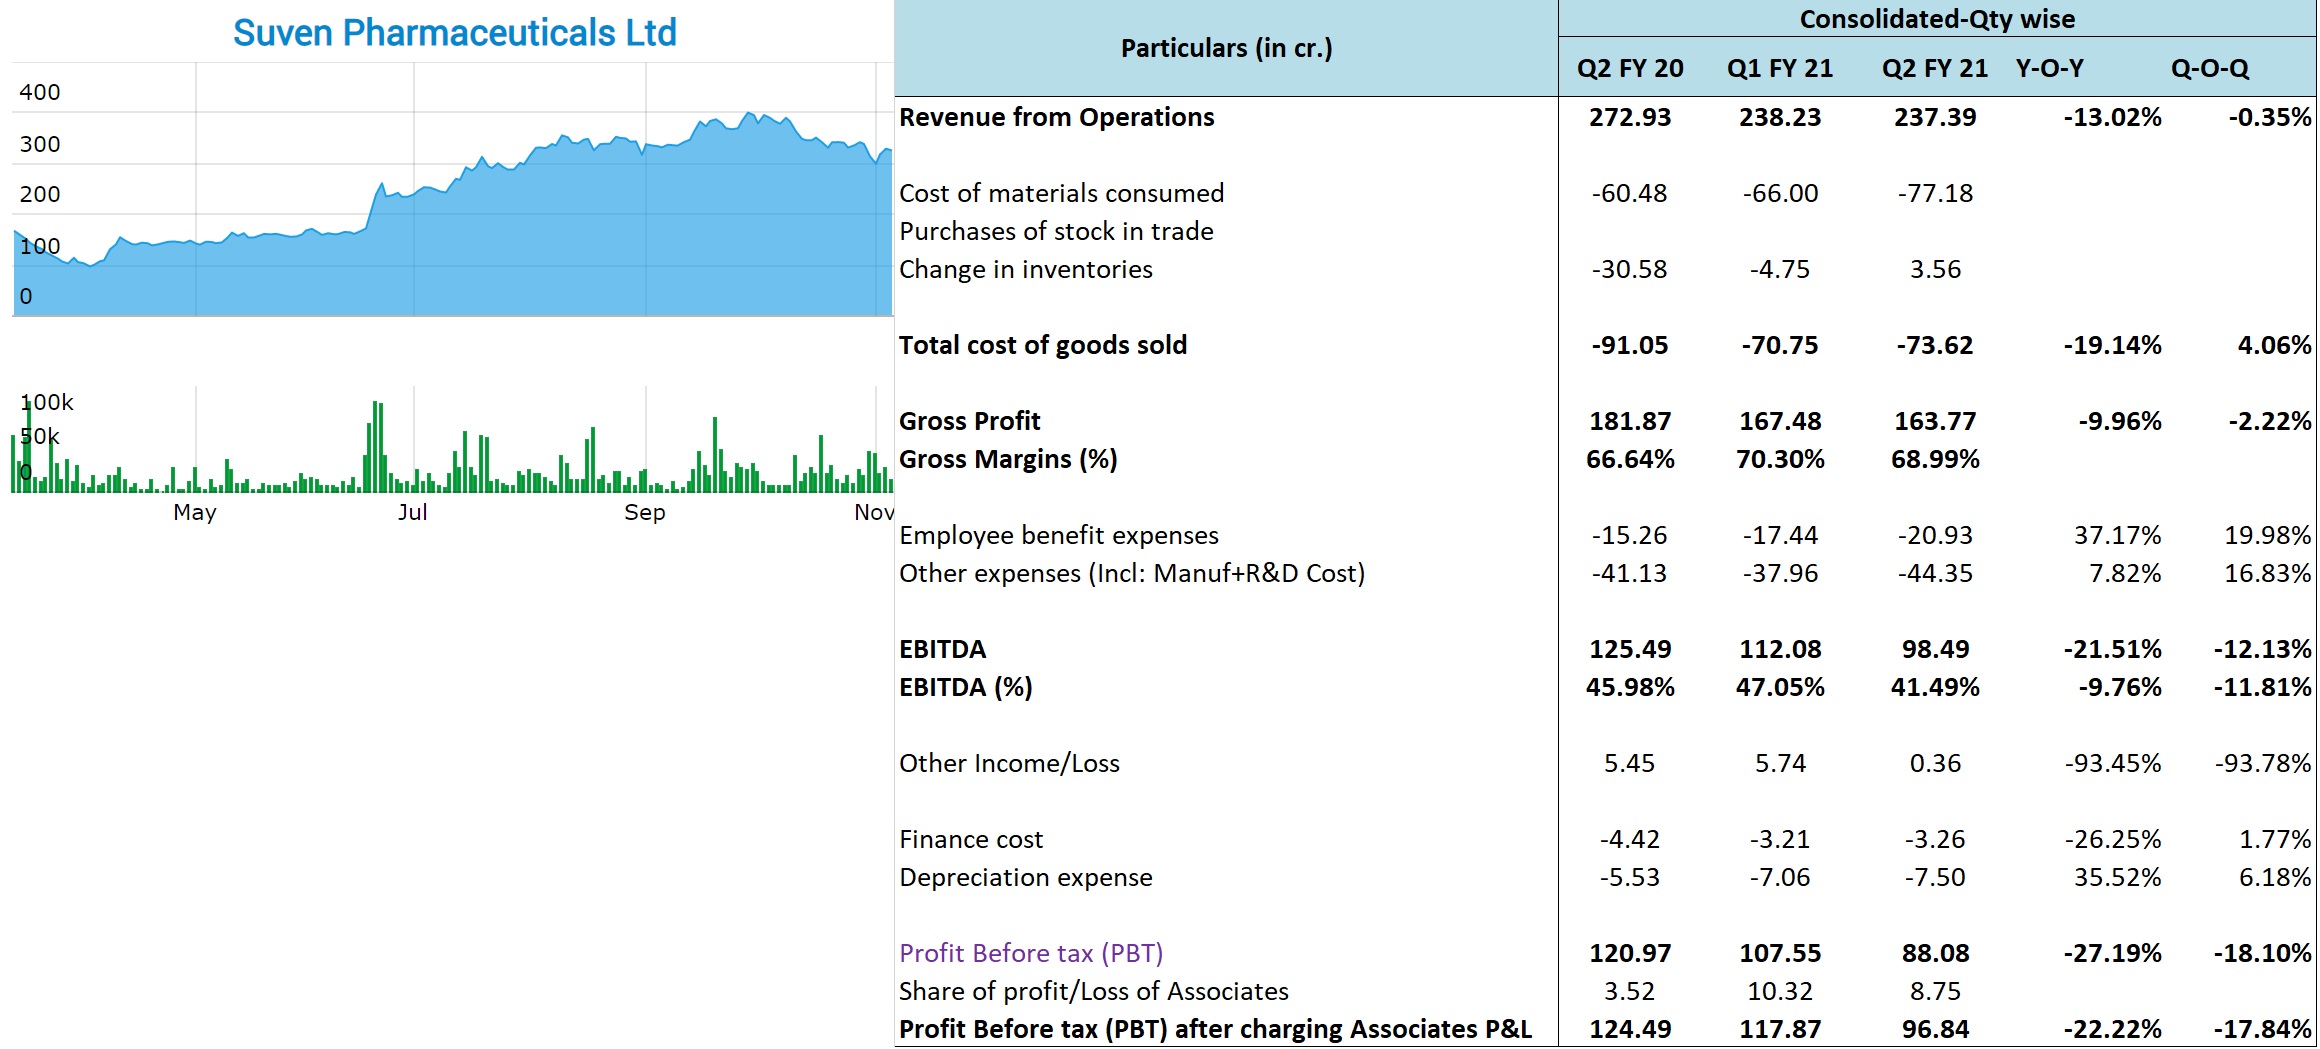
Coming back to results, Suven’s Performance tends to be lumpy as the sales depend on orders from its clients for various CRAMS molecules and Specialty molecules. Thus, full year results lend a much better picture of the performance of the company.
So, for Q2 FY 21, the company has reported 13% dip in sales on YOY basis. The same is on account of 30.27% drop in CRAMS (CDMO) sales, while the Specialty Chemical division has reported 25.59% growth and the Formulations and other technical division has reported 89.25% growth in sales.
Last year’s Q2 CRAMS sales included Rs 107 crore from commercial supplies and thus the base for the CRAMS division was unusually high for the September quarter.
With lower overall sales and higher expenses on account of Covid-19 and other manufacturing expenses related to the environmental impact, the EBITDA contracted by 21.51% with EBITDA margins of 41.49% against 45.98% recorded in Sep’19 quarter.
As per the management the product mix also wasn’t great, else the gross margins could have been higher.
With lower other income and slightly higher depreciation cost, the PBT has contracted by 27.19%.
On the Standalone basis the company has reported PBT of Rs 88.09 crore which is lower by 27.44% on YOY basis while on the consolidated basis it has also reported Rs 8.75 crore profit as its share of 25% investment in Rising Pharma.
Other Important Updates:
- As per the management, despite slightly subdued numbers in Q2, their guidance of 15-20% growth in topline and bottom line for FY 21 still holds. This is on the back of the visibility of the projects the company has and the expected commercialization of new Specialty chemical and formulations products
- During Q2, the traction for the CRAMS projects was better in comparison to Q1 and the company added 1 new customer
- In the CRAMS division, 1 product was already in Phase-3 which might move to commercial stage in 2021. Another product got added to Phase-3 recently and the company will be supplying for the same in the next 6 months
- In the CRAMS division the company currently supplies the intermediate for the molecule to its customers. The management is planning to supply both the API and the formulations to its CRAMS customers for their generic products
- Formulations – So far, the company has filed 11 ANDAs, commercialized 3 (including the old Taro one) and expects to launch 2 more before the end of the financial year. The management is planning to file 3-4 more ANDAs during the rest of the financial year and around 7-8 on annual basis
- As per the management, each product has the potential to generate around USD 2-4 million in profits for the company
- For the formulations business, the growth in topline may not be significant, but the profit contribution can be much higher. Basically, the company will be selling the molecule on cost + basis to its distribution partner and will then have 25-50% share in profits for each molecule. Thus, the management is hopeful of USD 2-4 million in profits from each molecule
- In fact, the management believes that profits from formulations business can be similar to CRAMS business in 2-3 years
- Specialty Chemical – The company is currently supplying 2 molecules and 2 more are under development. Management is confident of commercializing them in FY 21 and FY 22 respectively. At full scale of commercialization, each new molecule can deliver sales of around Rs 50 crore
- CAPEX – The company has taken approval from the board for a 600 crore CAPEX. The same will be for technology upgradation, facility upgradation, replacing old blocks with the new ones, R&D facility upgradation and probably 20-25% for capacity addition
- The management hasn’t yet finalized the details and Rs 600 crore is a guesstimate. As per the management, in order to survive and grow in this business, they have to constantly upgrade themselves. Also, earlier the cash flows were being used to fund the NCE business; however, now that NCE business has been demerged, they can use the cash flows for building capabilities for CRAMS, Specialty and formulations businesses.
Our assessment:
Suven Pharma is currently trading around 8,300 crore market cap. For FY 20 the company recorded consolidated PAT of Rs 317 crore and the management is guiding for 15-20% growth in bottom line for FY 21.
Over the last 2-3 years the company has made substantial investments in upgrading plants and creating new capacities for CRAMS and Formulations businesses.
In the CRAMS business, the company is trying to graduate to supply of APIs from Intermediates and that could give a boost to sales and profitability in the years to come.
Similarly, in Specialty Chemicals, the expected commercialization of 2 more molecules should help sustain the current run rate.
However, what could really drive the growth in PAT is the formulations business. Given the management’s estimate of USD 2-4 million profits from each molecule, the business can add ~150 crore PAT or even more over the course of next 3 years.
Thus, considering the diversification of revenue base, lower lumpiness and prospects of 15-20% CAGR in profitability over the next 2-4 years, we believe the valuations of ~25-27 times earnings are sustainable and therefore have a positive rating on the stock.
At the same time, it will be important to watch out for details on the proposed 600 crore CAPEX. While the management has been conservative and prudent in the past, it is difficult to ascertain if the proposed CAPEX is unsubstantiated or how much will it really add to the capabilities of the company.
Also, if the company takes on too much debt or dilutes substantial equity, then it could be a cause of concern for the shareholders.
Can Fin Homes (NSE – CANFINHOME) – May’13 Alpha stock
CMP – 463.90 (BSE); 461.20 (NSE)
Rating – Positive – 5% weightage; this is not an investment advice (refer rating interpretation)
Source: bseindia.com
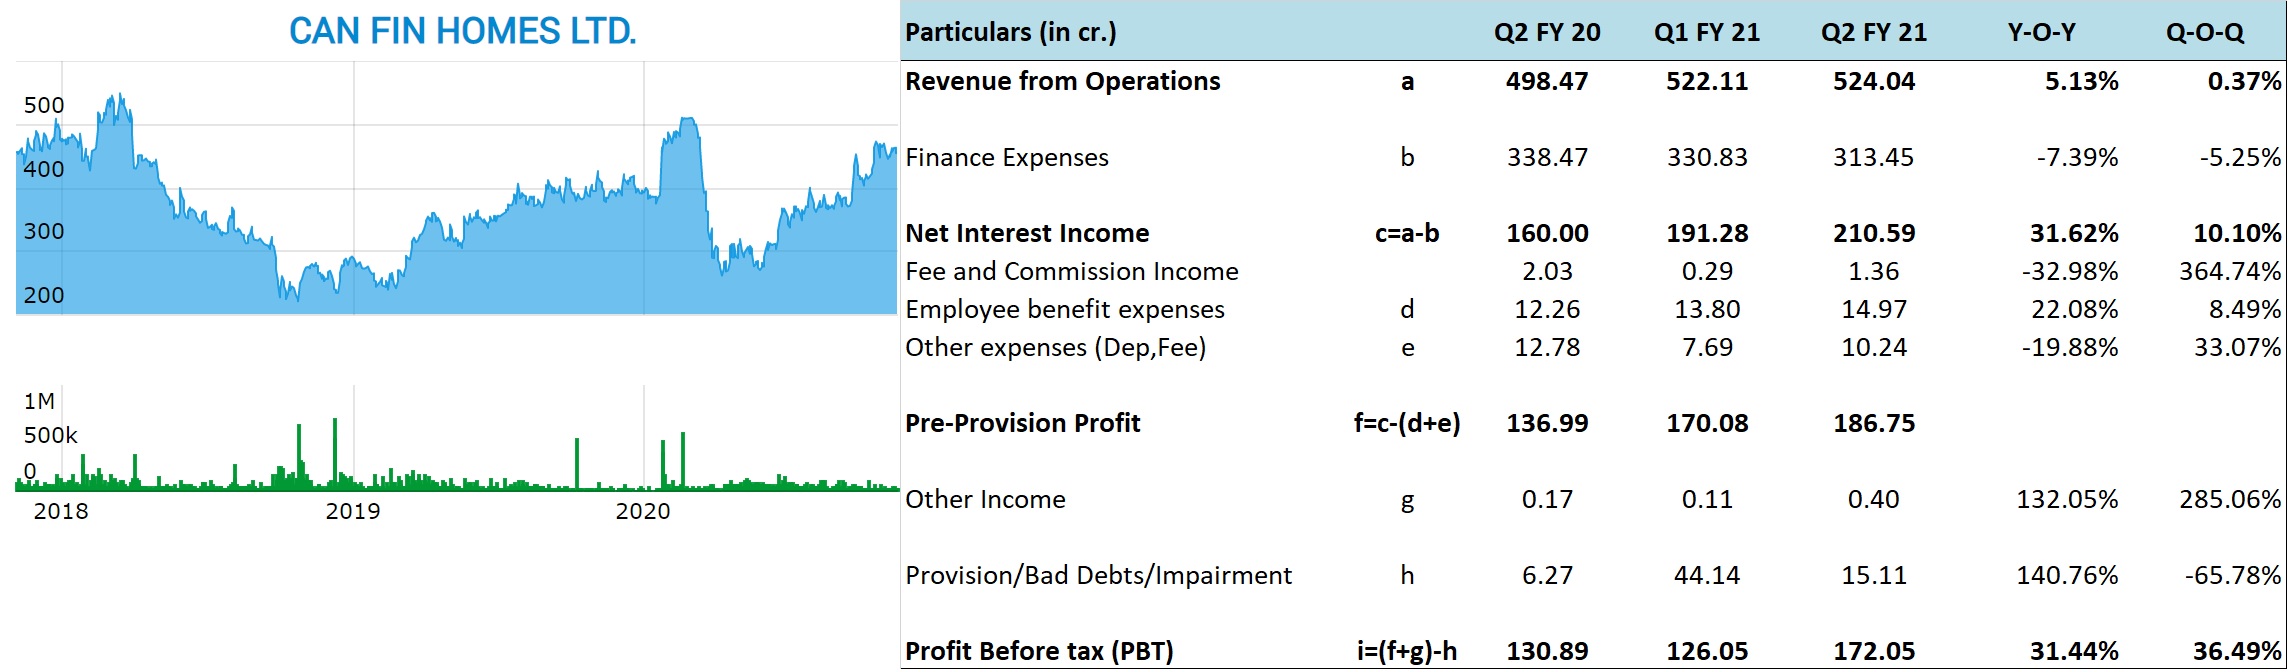
Can Fin has reported decent set of numbers for the quarter ending Sep’20.
The company has reported 31.62% growth in Net Interest income on YOY basis. This is against 6.27% growth in outstanding loan book to Rs 20,830 crore. In the last 1 year the yields have fallen by 27 bps to 9.96% against 85 bps decrease in cost of borrowing to 7.10%.
Thus, despite lower growth in loan book, 58 bps expansion in spread has helped the company report higher growth in NII.
As far as disbursements are concerned, they are down around 38% on YOY basis to Rs 825 crore, though up by more than 100% on sequential basis. As per the management, they have reached around 70% of their peak demand and expect the numbers to improve to 85% by Q4 and 100% by Q1-Q2 of FY 22.
While the demand is certainly improving, builders are still under stress and taking more time to complete the existing projects and launch the new ones.
In another development, the competitive intensity increased from both the Private and the PSU banks after the unlocking. The management noticed heightened activity in BT (business transfer) out and quickly put in a strong retention team in place to arrest the outflow. The company has also passed on benefits of lower interest cost to customers and the management is hopeful of heightened activity in BT to come down in the coming quarters.
At the same time, while the banks can poach customers from Can Fin because of their low-cost base, Can Fin is taking over customers from other HFCs that have both higher costs and also facing liquidity challenges.
Regarding cost of funding, the same has been coming down since the past few quarters and that’s across the board i.e. from all the sources. For Sep’20 the cost of borrowing was around 7.10% while the incremental is even lower.
As per the management, while they recorded 4.09% NIM in the Sep’20 quarter, sustaining the same would be difficult and the more reasonable levels would be 3.0% or thereabout and similarly the spread should sustain around 2.4% than 2.86% recorded in Sep’20.
On the front of asset quality, in the month of September, the company recorded collection efficiency of 93% which is somewhat better than Pre-Covid months. 93% collection efficiency for the September month is important as September was the first month after the 2-part moratorium ended in Aug’20.
In another important development, company’s delinquent pool of Rs 1,444 crore as of 1st March 2020 stands reduced to around Rs 670 as of September end. Delinquent pool is basically any amount which is overdue and not yet converted to NPA.
During the quarter, the company’s Gross NPAs were slightly lower at Rs 150 crore (0.72%) against Rs 155 crore (0.79%) in the year ago quarter. On ignoring the Supreme Court’s order of not declaring the certain accounts as NPA, the gross NPAs would have been higher at 0.78%.
As per the management, they have provided Rs 86 crore towards Covid-19 related provisioning and believe the same is more than sufficient to absorb any shock from related NPAs.
Going forward, the management expects some increase in NPAs in Q3 and Q4; however, based on the recoveries recorded in SMA-2 book till now, they are hopeful of bringing back the NPAs to current levels in the next 4 quarters.
Can fin’s borrower profile mix is inclined towards Salaried and Professionals at 71% against 29% for SENP. Also, as around 90% of the loans are for housing and that too for self-occupation than for investment, the management expects the deterioration in asset quality to be much lower on relative basis.
Outlook – We don’t expect significant growth in FY 21 with recovery in loan demand expected only from Q1 FY22. Also, even though the company opened offices from 20th Apr’20 and started disbursements from the fourth week of May, all this while their focus has been on collections, recovery and educating the customers about the pros and cons of availing the moratorium.
While they have seen good pickup in demand it is still early days in terms of predicting the demand trajectory.
The good thing about Can Fin is that its asset quality is robust, has a good customer profile, only about Rs 5 crore (out of more than Rs 20,000 crore loan book) in developer loans, robust liquidity position and therefore it should do well and probably gain market share when the demand recovers.
At the same time, one will have to be watchful of how the asset quality is impacted from here on. As mentioned above, the real picture on the asset quality will emerge from Q3 onwards.
The stock is currently trading around 2.62 times book value and 14.8 times trailing twelve months earnings and we believe the valuations are reasonable considering the past performance, asset quality and the growth outlook in the wake of several HFCs facing a lot of challenges.
Disclosure: I have personal investment in Suven Pharmaceuticals and my father holds investments in Can Fin Homes.
Best Regards,
Ekansh Mittal
Research Analyst
https://www.katalystwealth.com/
Ph.: +91-727-5050062, Mob: +91-9818866676
Email: [email protected]
Rating Interpretation
Positive – Expected return of ~15% + on annualized basis in medium to long term for investment recommendations and in short term for Special situations
Neutral – Expected Absolute return in the range of +/- 15%
Negative – Expected Absolute return of over -15%
Coverage closure – No further update on the stock
% weightage – allocation in the subject stock with respect to equity investments
Short term – Less than 1 year
Medium term – Greater than 1 year and less than 3 years
Long term – Greater than 3 years
Research Analyst Details
Name: Ekansh Mittal Email Id: [email protected] Ph: +91 727 5050062
Analyst ownership of the stock: In Suven Pharmaceuticals
Details of Associates: Not Applicable
Analyst Certification: The Analyst certify (ies) that the views expressed herein accurately reflect his (their) personal view(s) about the subject security (ies) and issuer(s) and that no part of his (their) compensation was, is or will be directly or indirectly related to the specific recommendation(s) or views contained in this research report.
Disclaimer: www.katalystwealth.com (here in referred to as Katalyst Wealth) is the domain owned by Ekansh Mittal. Mr. Ekansh Mittal is the sole proprietor of Mittal Consulting and offers independent equity research services to investors on subscription basis. SEBI (Research Analyst) Regulations 2014, Registration No. INH100001690
The views expressed are based solely on information available publicly and believed to be true. Investors are advised to independently evaluate the market conditions/risks involved before making any investment decision
A graph of daily closing prices of securities is available at www.bseindia.com (Choose a company from the list on the browser and select the “three years” period in the price chart
This report is for the personal information of the authorized recipient and does not construe to be any investment, legal or taxation advice to you. Ekansh Mittal/Mittal Consulting/Katalyst Wealth is not soliciting any action based upon it. This report is not for public distribution and has been furnished to you solely for your information and should not be reproduced or redistributed to any other person in any form. This document is provided for assistance only and is not intended to be and must not alone be taken as the basis for an investment decision. Ekansh Mittal or any of its affiliates or employees shall not be in any way responsible for any loss or damage that may arise to any person from any inadvertent error in the information contained in this report. Neither Ekansh Mittal, nor its employees, agents nor representatives shall be liable for any damages whether direct or indirect, incidental, special or consequential including lost revenue or lost profits that may arise from or in connection with the use of the information. Ekansh Mittal/Mittal Consulting or any of its affiliates or employees do not provide, at any time, any express or implied warranty of any kind, regarding any matter pertaining to this report, including without limitation the implied warranties of merchantability, fitness for a particular purpose, and non-infringement.
The recipients of this report should rely on their own investigations. Ekansh Mittal/Mittal Consulting and/or its affiliates and/or employees may have interests/ positions, financial or otherwise in the securities mentioned in this report. Mittal Consulting has incorporated adequate disclosures in this document. This should, however, not be treated as endorsement of the views expressed in the report.
We submit that no material disciplinary action has been taken on Ekansh Mittal by any regulatory authority impacting Equity Research Analysis.
Disclosure (SEBI RA Regulations)
Whether the research analyst or research entity or his associate or his relative has any financial interest in the subject company/companies and the nature of such financial interest – Yes, Investment in Suven Pharmaceuticals. Also, father holds investments in Can Fin Homes.
Whether the research analyst or research entity or his associates or his relatives have actual/beneficial ownership of 1% or more securities of the subject company (at the end of the month immediately preceding the date of publication of the research report or date of the public appearance) – No
Whether the research analyst or research entity or his associate or his relative has any other material conflict of interest at the time of publication of the research report or at the time of public appearance – No
Whether it or its associates have received any compensation from the subject company in the past twelve months – No
Whether it or its associates have managed or co-managed public offering of securities for the subject company in the past 12 months – No
Whether it or its associates have received any compensation for investment banking or merchant banking or brokerage services from the subject company in the past 12 months – No
Whether it or its associates have received any compensation for products or services other than investment banking or merchant banking or brokerage services from the subject company in the past 12 months – No
Whether the subject company is or was a client during twelve months preceding the date of distribution of the research report and the types of services provided – No
Whether the research analyst has served as an officer, director or employee of the subject company – No
Whether the research analyst or research entity has been engaged in market making activity for the subject company – No