Hello Sir,
Hope you are doing well.
The moot question everyone asking these days is if the market has bottomed out or not?
There are no definite answers; however, if we had to look at 1 data point to understand which zone the market is in or where it is headed, we look at the following chart.
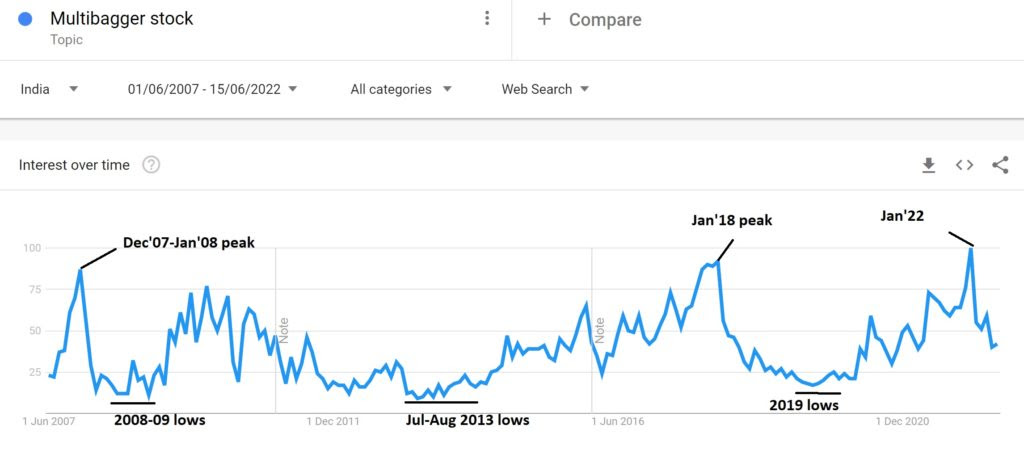
What is it? – It is a graph from Google trends for the search term ‘Multibagger stocks’. It depicts investor participation/interest (through google search for term ‘Multibagger Stock’) at various points of time.
As the chart indicates, the investor’s interest peaked and bottomed around the same time the markets peaked and bottomed out.
As we all know, markets topped out in Jan’08, Oct’10, Jan’18 and Jan’22 and what is interesting to note that even the Google Trends graph (for search term “Multibagger stocks”) topped out in Dec’07, Jan’18 and now in Jan’22.
Similarly, the markets formed a bottom around late 2008, mid 2013, mid 2019 and the Google trends graph also bottomed around Sep’08-Feb’09, Jul-Aug’13, Jul-Aug’19.
Just to add here, the above graph is more relevant for Small and Mid cap indices.
What is the Graph suggesting now? – While the market is throwing good opportunities for buying, it has this tendency of swinging to extremes and looking at the current trend and the past trends, it seems like the market bottom is still some time away.
It could be a grinding market for the next 6-12 months wherein there will be days of panic selling and then some consolidation.
Overall, the next 6-12 months should be a good period for buying, but don’t expect immediate run-up, in fact it’s quite possible that you may buy something reasonably valued and may later find it 20% cheaper.
To sum it up, next 6-12 months should be a good period for accumulation of stocks if your investment horizon is 3-4 years or more.
Remember, this isn’t a very sophisticated data point, nor quoting this chart will make you look intelligent. However, it does its job well and that’s what you should be concerned about, i.e., making money and reading markets better than sounding intelligent.
Lastly, we would never advocate being completely out of the market; however the above graph can definitely help managing liquidity in your portfolio in terms of deciding when to raise some cash (say 20-25%) or to be invested almost fully.
Best Regards,
Ekansh Mittal
Research Analyst
Web: (opens in new tab)https://www.katalystwealth.