Hello Sir,
Hope you are doing well.
It’s quite common for people in general to talk about good returns delivered by real estate or gold held by them or their forefathers.
What’s mostly forgotten during the discussion is the holding period of the investment and the returns in terms of CAGR.
Almost always, the holding period is 5-10-20 years or more.
Now, look at this below chart of NIFTY which depicts annualized returns from 1995-2023.
What’s interesting about the chart is that it gives annualized returns data over 1, 3, 5 and 10 years rolling periods.
What is rolling period return? If an investment displays a 12% annualized return over a 10-year rolling period, it means that if you held the investment for 10 years, you earned the equivalent of 12% a year, yet during those 10 years, returns could have varied drastically each year.
Tomorrow, we will be sharing our New stock recommendation with our Alpha and Alpha + Members
You can get it at the same time as our Premium Members by subscribing HERE
NIFTY annualized returns - 1/ 3/ 5/ 10 year rolling periods
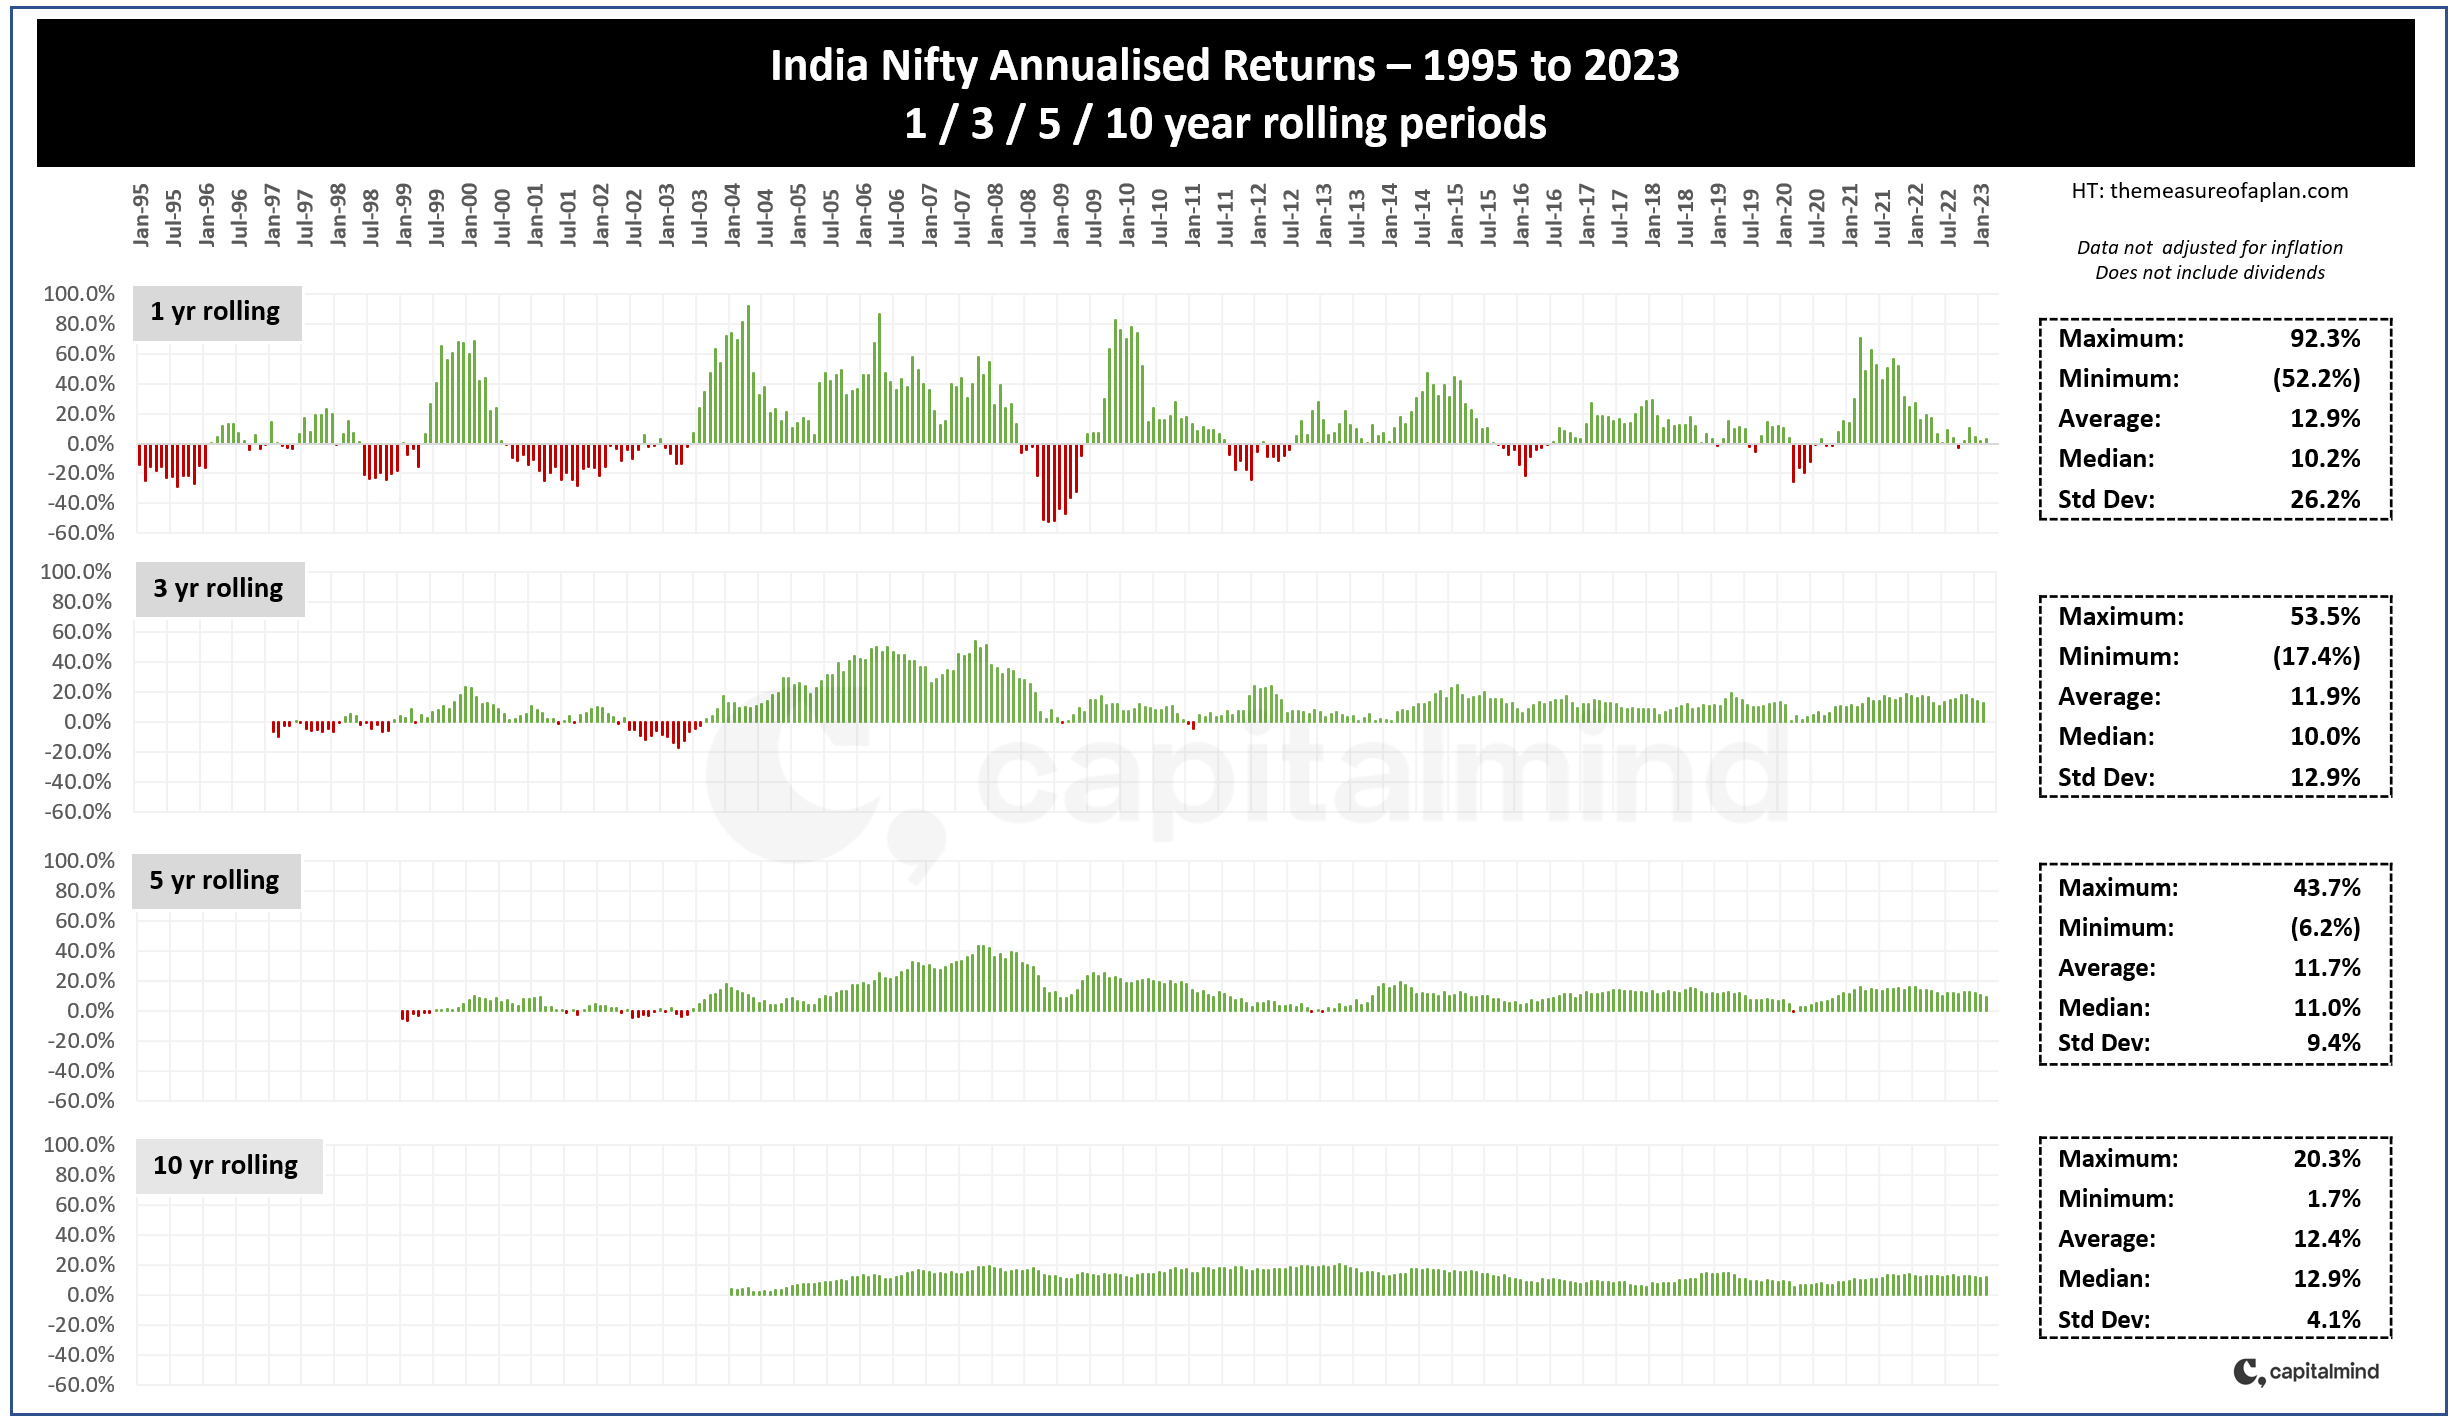
Source: Capital Mind
As can be observed above, the 1 year rolling returns of NIFTY have been volatile with the maximum being 92.3% return in a year (2003-04) to the lowest being 52.2% drop in a year (2008-09) and the average being 12.9%.
This volatility over shorter periods is the major reason why most investors don’t make money in the stock market.
Now, let’s look at 3, 5 and 10 years rolling period data.
3 years rolling period data – On a 3 year basis, the volatility in returns is significantly lower than 1 year and the 3 years annualized returns have largely been positive 2004 onwards with the maximum being 53.5% CAGR (2006-08) and the average being 11.9% CAGR.
5 years rolling period data – further reduction in volatility in returns and again almost zero instances of negative returns over a 5 year holding period 2004 onwards. The average 5 years rolling annualized returns being 11.7%.
10 years rolling period data – This is the most interesting chart. As can be observed, zero instances of negative returns over 10 years rolling period. Yes, zilch.
What’s interesting is that average 10 years rolling returns have been 12.4% CAGR, maximum 20.3% CAGR and minimum 1.7% CAGR.
Standard deviation data - lowest at 4.1% for 10 years and highest at 26.2% for 1 year, indicating volatility in returns reduces significantly over longer periods of investment.
Next time someone talks about great returns on real estate and cribs about losses in the stock market, you can show them this chart and explain the importance of long term investing in stocks similar to real estate.
The advantage with the stock market is one can make small investments and accumulate gradually.
Another advantage is that there are times like 2008-09, 2011-13, 2018-20 or the one we are currently going through when the market is in correction mode and thus one gets an opportunity to buy stocks at much lower valuations resulting in good gains in subsequent years (think in terms of 3-5 years).
Thus, stock market corrections are not bad from long term investment perspective, provided you don't panic and throw in the towel.
(End)