Dear Members,
We have released 29th Sep’23: Greenply Industries Ltd (NSE Code – GREENPLY) – Alpha/Alpha Plus stock for Sep’23. For details and other updates, please log into the website at the following link – http://katalystwealth.com/index.php/my-account/
Note: For any queries, mail us at [email protected]
Date: 29th Sep’23
CMP – 164.80 (BSE); 164.25 (NSE) Face Value – 1.00
Rating – Positive – 4% weightage (this is not an investment advice, refer rating interpretation)
Introduction
Established in 1990, Greenply is one of India’s leading manufacturers of plywood (accounts for around 25% of organised market share) and is an established brand with a pan-India presence.
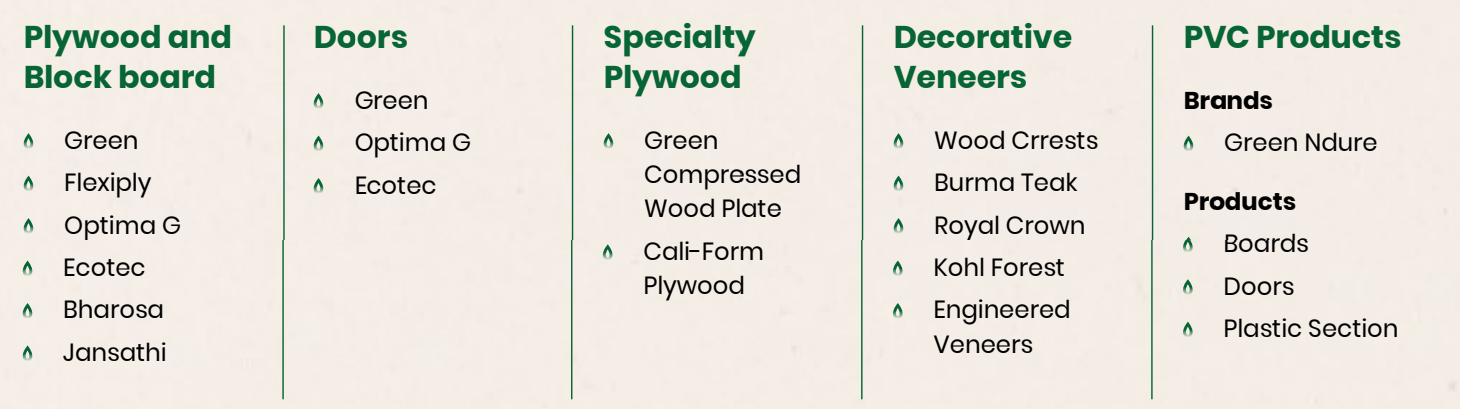
The company’s product portfolio comprises plywood and blockboards, decorative veneers, flush doors, specialty plywood, Polyvinyl Chloride (PVC) products and recently the company has again introduced Medium Density Fiber (MDF) board.
At around CMP of 165, we like the company for the following key reasons:
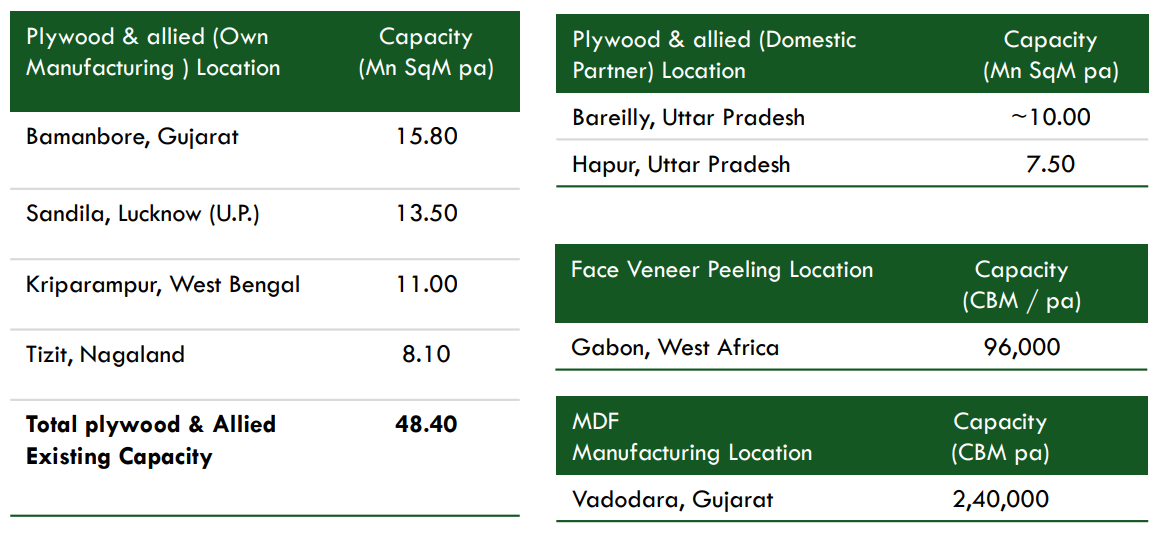
- MDF capacity set up – In 2018-19, Greenply’s MDF unit got demerged and listed separately as Greenpanel. However, recently, the company completed the setup of 240,000 CBM (cubic meter) MDF capacity and commenced commercial production in Q1 FY 24. This could be the major growth driver over the next 3-4 years
- Plywood capacity expansion – In Jun’22, the company commenced a greenfield plywood manufacturing facility in Sandila, Uttar Pradesh which enhanced the consolidated manufacturing capacity (own) by 39%. The management is targeting 10-12% volume CAGR for the next 2-3 years
- Scope for margin expansion – Since the past few quarters the plywood segment is reeling under the pressure of higher timber prices. With higher volumes and price hikes, the management is targeting double digit EBITDA margins
- Entry barriers – Being a wood-based industry, the plywood sector has high entry barriers with restrained issue of licences on the back of environmental concerns. In the case of MDF, being highly capital intensive, it is largely dominated by 4-5 organized players
- Reasonable valuations – Greenply is currently trading around 1.1 times sales. Barring Covid-19 lows, the stock has largely traded between 1.1-2.4 times sales over the last 7-8 years. We are not considering PE ratio because currently the earnings are impacted on account of MDF capex (yet to contribute) and exceptional loss in a JV
- Expected reduction in debt – Currently the debt levels are elevated due to MDF capacity setup; however, it should start reducing 1 year down the line as the MDF business starts generating cash flows
Overall, we believe there’s potential for the company to increase its PAT to Rs 150-200 crore over the next 3-4 years from the current Rs 70-90 crore range.
Business details
Greenply is one of India’s leading manufacturers of plywood (accounts for around 25% of organised market share) and has again forayed into MDF space after the demerger of MDF business to Greenpanel in 2018-19.
Source: Greenply’s Q1 FY 24 presentation

Source: Greenply’s AR 23
The company has the above corporate structure.
- It has a subsidiary in Singapore which has invested in a JV company that is engaged in trading of Veneers. The JV has invested in a wholly owned subsidiary in Myanmar which is engaged in manufacturing and trading of veneer and lumber
- It has another subsidiary in Dubai which is engaged in trading of veneers. The Dubai subsidiary has a wholly owned subsidiary in Gabon which is engaged in manufacturing and trading of veneer and lumber
- Greenply has incorporated a subsidiary in Sandila, UP, which is engaged in manufacturing of plywood. The Sandila unit increased the consolidated manufacturing capacity (own) by 39% and commenced operations in Jun’22
- Greenply Speciality Panels was incorporated for setting up MDF unit in Gujarat. The commercial production at the said unit commenced on 5th May’23
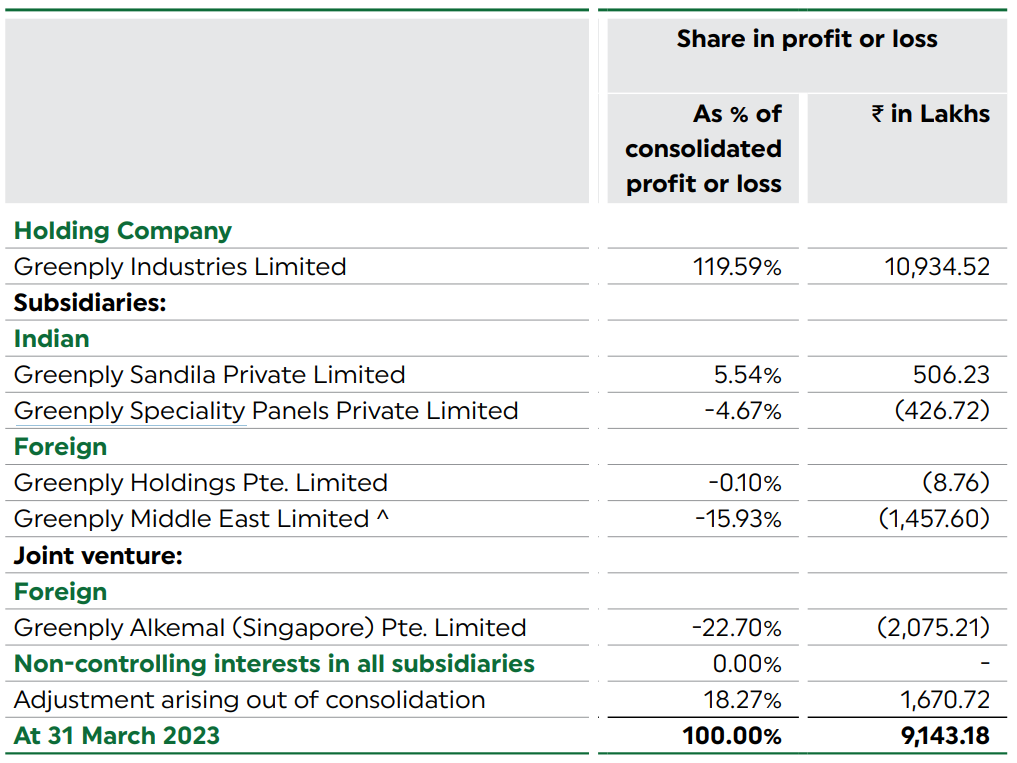
Source: Greenply’s AR 23
As can be noticed above, Greenply Industries on standalone basis reported higher profit than on consolidated basis. Similarly, the Sandila unit, which is involved in plywood manufacturing, contributed to profit in its first year of commercial operations.
The MDF unit commenced operations in Q1 FY 24. The same is likely to report losses in FY 24 due to gradual increase in capacity utilization and higher interest and depreciation costs.
However, it should be a major profit centre for the company once it reaches peak capacity utilization in FY 26-27.
The Singapore subsidiary reported the highest loss in FY 23. It was on account of disposal of manufacturing assets by the Myanmar unit due to political and adverse business environment in Myanmar.
Lastly, the Middle east unit reported losses on account of losses at Gabon subsidiary. As per the management, there are demand side challenges and their primary objective is to breakeven.
Plywood and allied products
Plywood and allied products like veneer is the main product segment for the company and as mentioned above, the company accounts for around 25% of organized market share.
Source: Greenply’s AR 23
In the past, the company also dealt in Laminates and MDF; however, the 2 segments got demerged over FY 15-FY 19. Also, a plywood unit in Pantnagar got demerged and transferred to Greenpanel in FY 19.
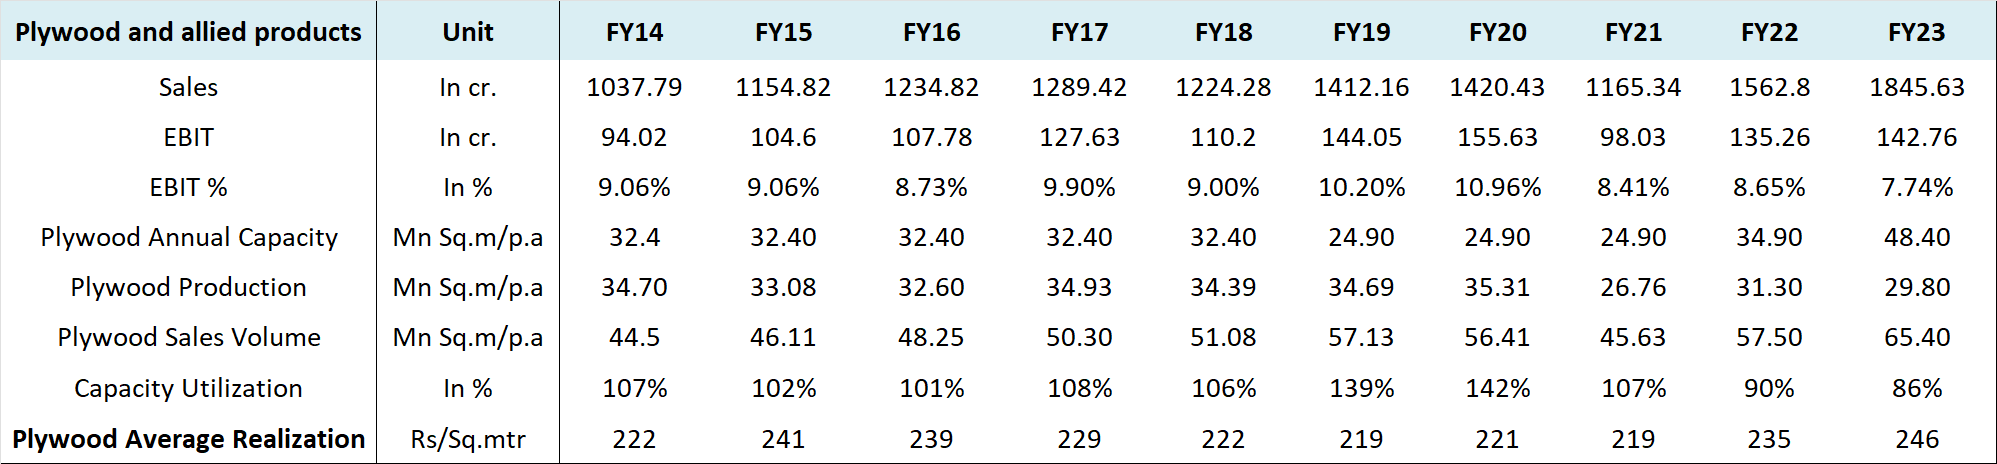
Source: Greenply’s Annual Reports
As can be observed above, there’s been a steady growth in the plywood segment of the company.
Greenply uses its own manufacturing capacity primarily for the premium segment plywood and has been operating it at 85% + utilization levels since long.
From Jun’22, the company increased the capacity by 39% by commencing a greenfield plywood manufacturing facility in Sandila, Uttar Pradesh which operated at 60% utilisation level in Q4 FY 23.
For mid-segment and mass-segment plywood demand, the company follows the asset-light model of outsourcing (trading) plywood manufacturing and rebranding under its own brand, thereby freeing own capacity for premium variants.
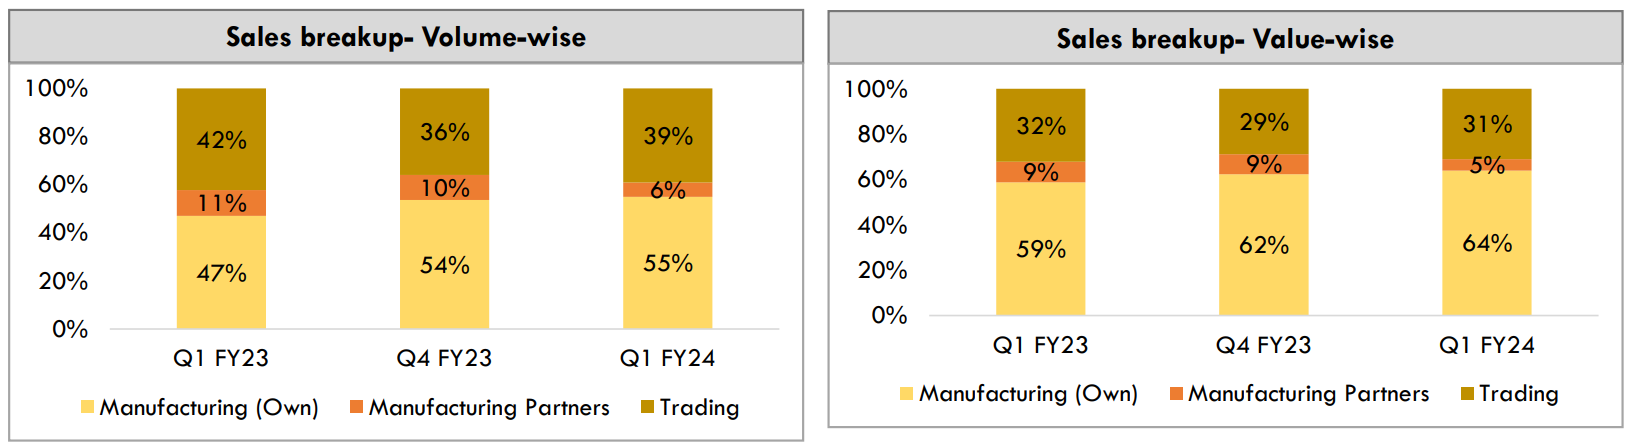
Source: Greenply’s Q1 FY 24 presentation
Furthermore, over FY20-FY22, Greenply entered three ventures through minority equity participation (less than 20% stake) with regional manufacturers in Bareilly and Hapur, Uttar Pradesh for an assured supply of premium segment plywood and other allied products.
Expectations for Plywood business – The company achieved over 18% growth in Plywood and allied products sales in FY 23 over FY 22 and is aiming for 10-12% CAGR in volumes over the next 3 years or so.
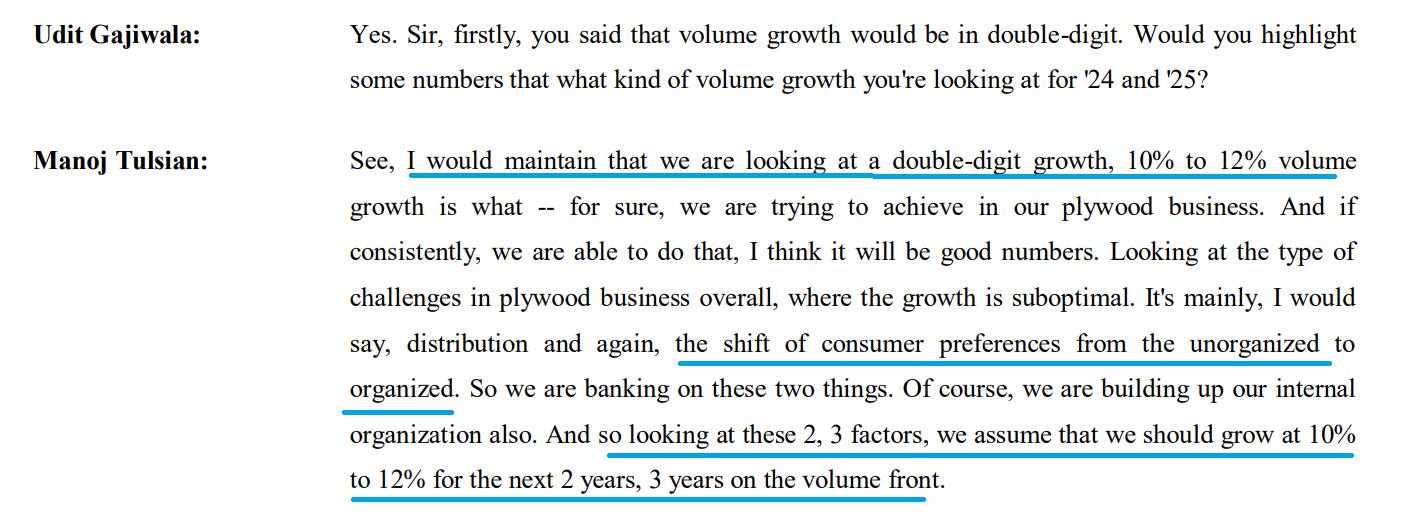
Source: Greenply’s Q4 FY 23 concall
Off late, the EBITDA margins on Plywood segment have dipped to below 9% because of higher timber costs; however, the management is planning to take price hikes and on the back of the same, along with operating leverage, the management is targeting double digit EBITDA margins for the full year.
MDF
As mentioned above, before de-merger, Greenply had a 180,000 CBM MDF capacity.
The same got demerged and transferred to Greenpanel in FY 19.
However, the company has again set up a MDF unit under its wholly owned subsidiary Greenply Speciality Panels. The unit has been set up in Gujarat with 240,000 CBM capacity and the same commenced commercial production on 5th May’23.
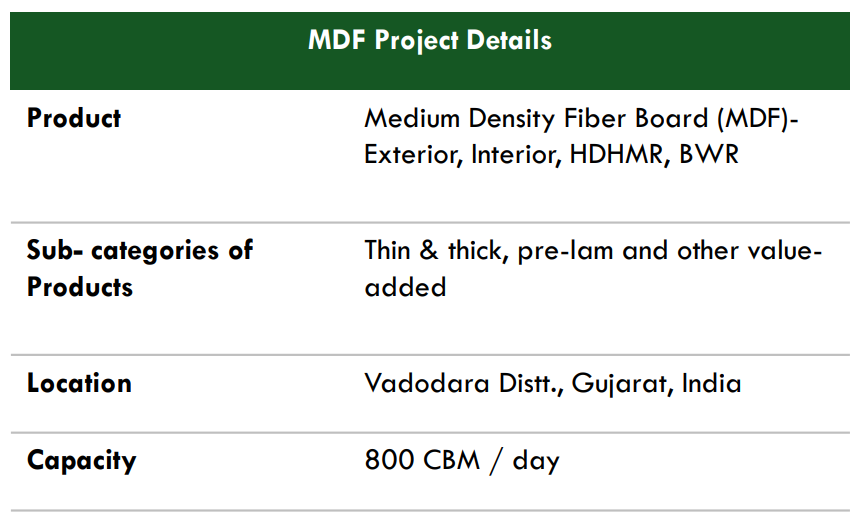
Source: Greenply’s Q1 FY 24 presentation
The company has spent around Rs 550 crore on the MDF project.
As per the management, their focus will be on western and central regions of the country; however, they will be distributing across the country.
Regarding raw material, more than 60% will be sourced locally and the balance from all parts of the country.
Unlike other MDF manufacturers, the company has zero export liability and will not be an area of focus; however, to fight out tough times, the company might consider exporting 3%-4% of the capacity.
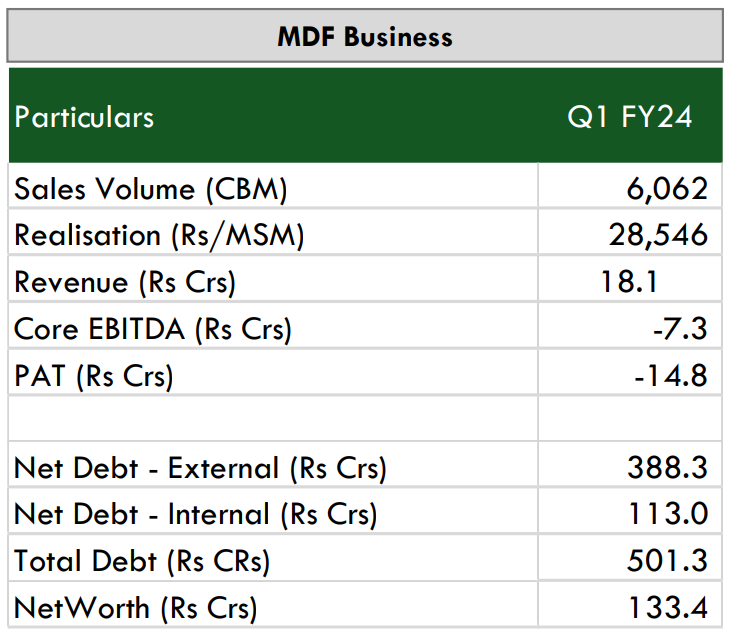
For FY 24, the management is targeting 1 lakh CBM sales with sales potential of Rs 275-300 crore. Next year, the management is targeting 160,000-180,000 CBM and full capacity utilization in the 3rd year with sustainable EBITDA margins of 20-22% on long term basis.
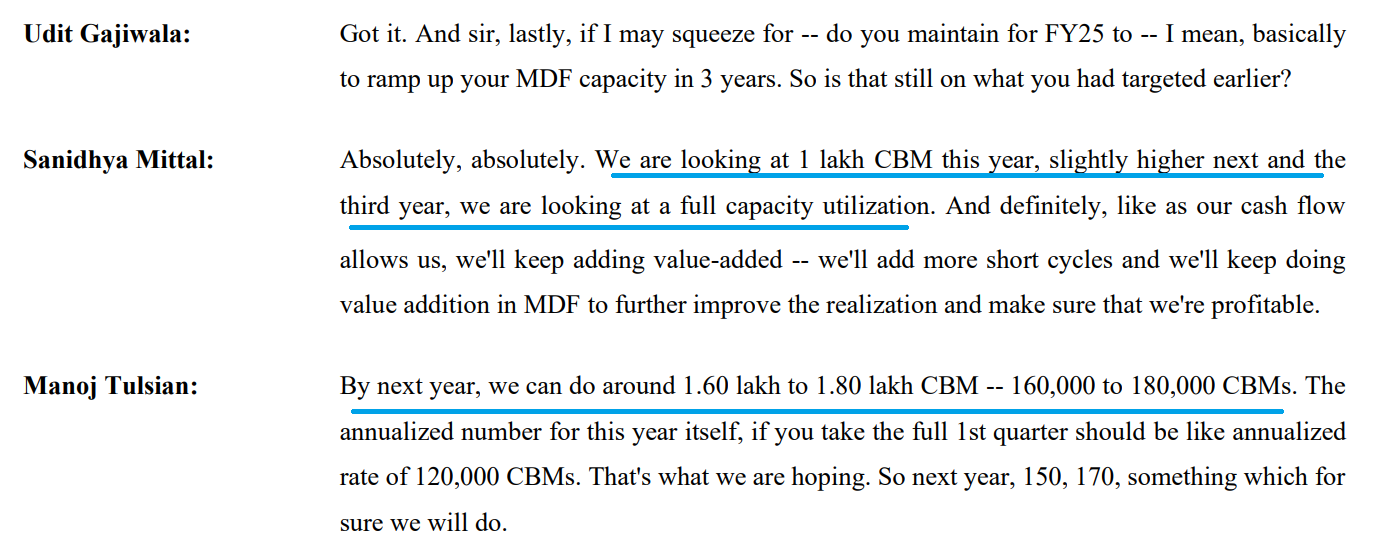
Source: Greenply’s Q1 FY 24 concall
Overview of Woodpanel sector
Here’s a brief overview of woodpanel sector based on a detailed report by Prabhudas Lilladher.
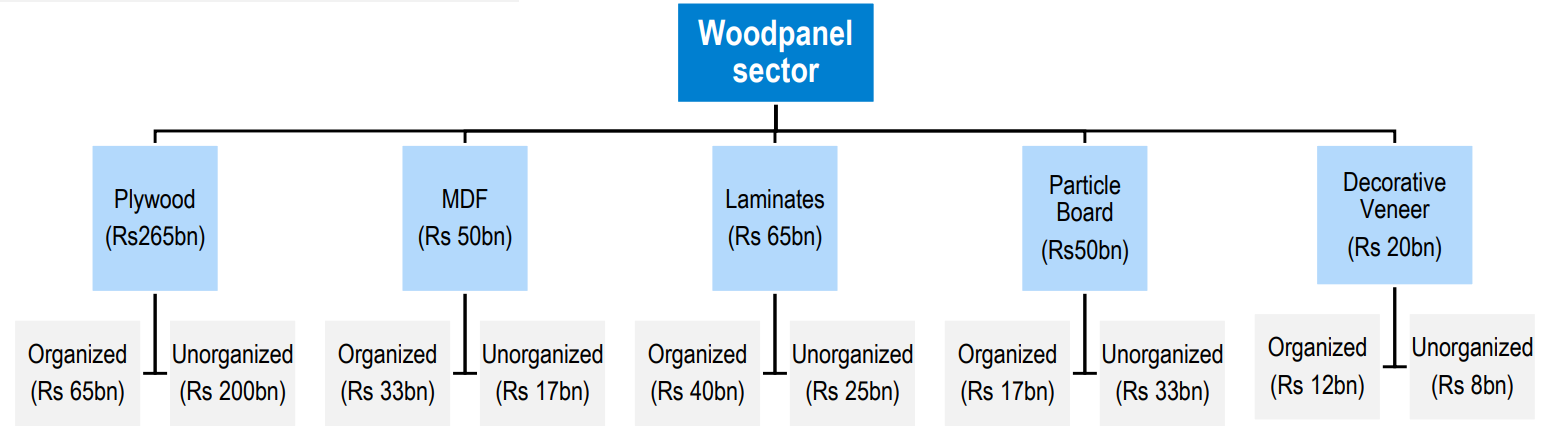
Source: Prabhudas Lilladher Jul’23 woodpanel report
Indian wood panel industry is currently pegged at ~Rs 43,000 crore (FY 23) and is expected to record 7.2% CAGR over FY23-FY26 in anticipation of revival in end user industries i.e., 1) Real estate and 2) Furniture market.
Plywood is the biggest segment in wood panel sector valued at Rs 26,500 crore (FY23); however, it is largely unorganized at around 75%. Branded players like Greenply, Century largely operate in Premium and Mid segments, while the unorganized players dominate the low end segment.
As per the report, the plywood segment is expected to record 5% CAGR over the next 3 years.
MDF industry in India is around Rs 5,000 crore at present and growing much faster than other segments.
Unlike plywood, organised players account for 65% of the market.
MDF is increasingly being used as a substitute for low to medium quality plywood, as it is 30-35% cheaper.
MDF was not always popular in India; however, readymade furniture players like Pepperfry in India and IKEA globally use MDF for their products and rising preference for readymade furniture is driving a strong demand for MDF in India.
Globally, MDF, Plywood ratio across the world is nearly ~70:30, whereas in India it is ~20:80 and expected to become 50:50 in a few years.
The MDF share in India has increased from 10% a few years back to 20% currently.
While the demand for MDF has been strong, it also goes through phases of supply glut and pricing pressure due to excess capacity and imports.
Since 2010, the domestic MDF capacity has increased from 0.15 mn CBM to 2.3 mn CBM in 2022 and the same is likely to increase to 3.5 mn CBM by FY 26.
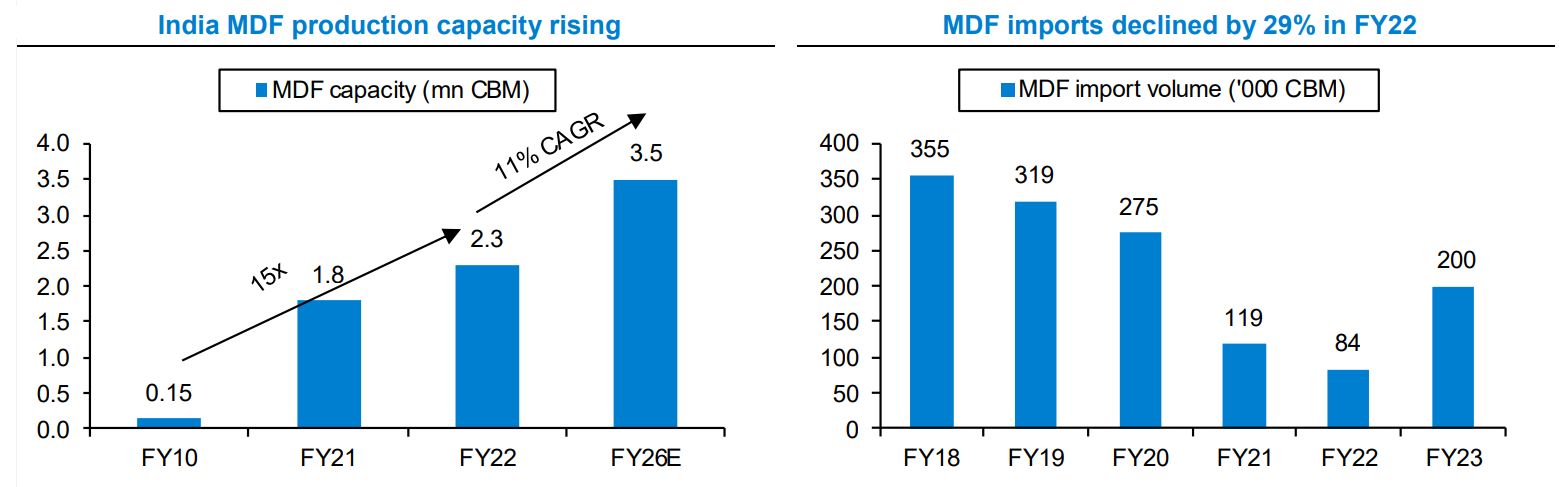
Source: Prabhudas Lilladher Jul’23 woodpanel report
Last time, most new supply came between FY18-20, which led to a steep correction in MDF prices on account of price war started by peers.
Eventually with no new capacity addition in 2020-21 and reduction in imports, price recovered. Again, with increase in capacity and rising imports, MDF realizations have come down but not as low as past.
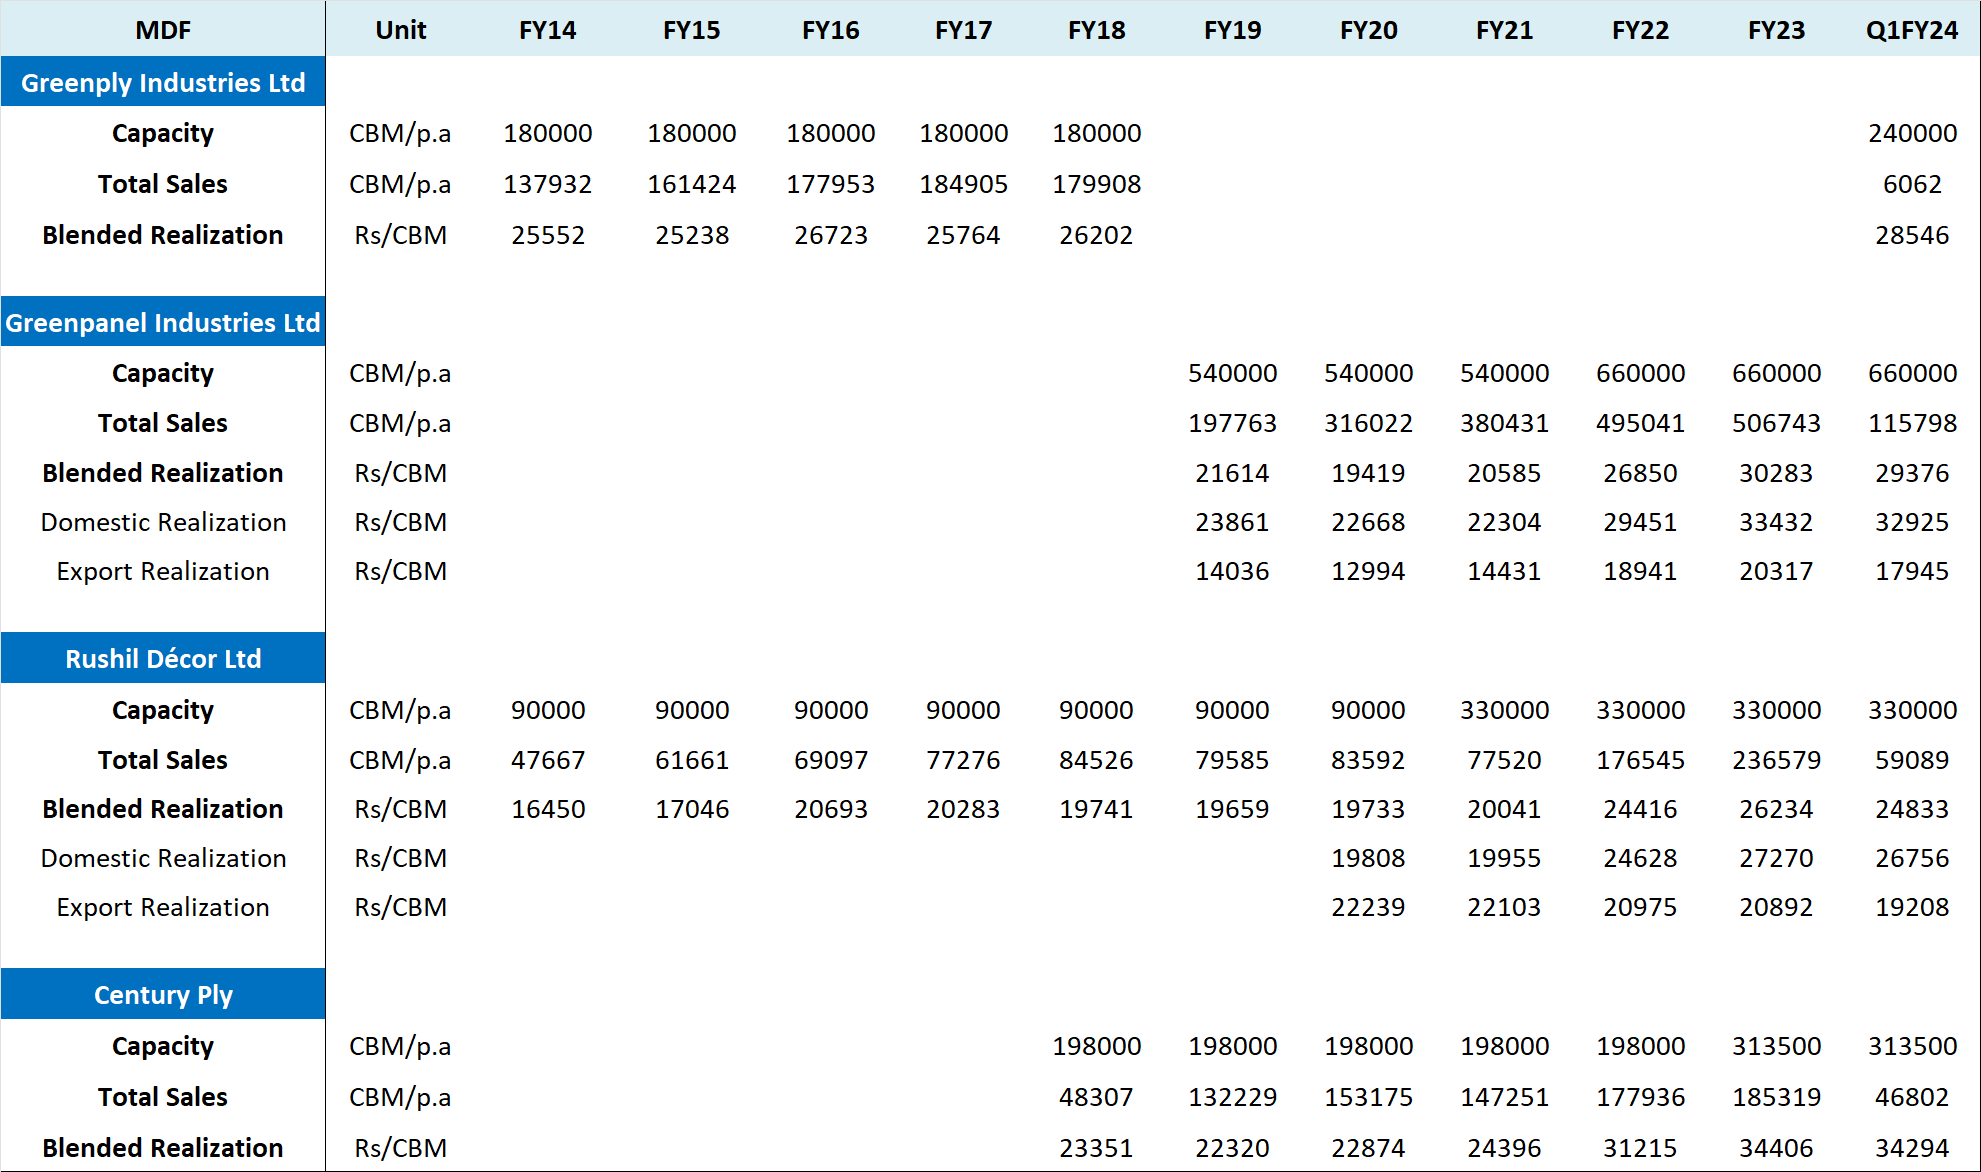
Source: Company’s Annual Reports and Presentations
In the above comparison, we have shared the MDF capacity, sales volume, and realizations for major listed MDF manufacturers.
Besides the capacity mentioned above, Centuryply is doubling the capacity with expected commercialization of 313,500 CBM in Andhra Pradesh in H2 FY 24 and Greenpanel will be increasing the capacity by 231,000 CBM in Andhra Pradesh by Q1 FY 25.
As can be noticed, despite the recent fall in realizations, the domestic realizations continue to be Rs 30,000 + per CBM for companies like Greenpanel and Centuryply.
Valuations
The stock is currently quoting at a market cap of ~Rs 2000 crore.
The company has net debt of around 730 crore and out of the same around 500 crore pertains to the new MDF unit.
The debt may start reducing as the MDF business starts generating cash flows. The repayment schedule for the 3 years is as follows: Rs 42 crore in FY 24, Rs 56 crore in FY 25 and Rs 64 crore in FY 26.
As per the management, they expect interest cost of around Rs 53 crore on consolidated basis (including MDF unit and Gabon). This may reduce 2-3 years down the line in case of a good performance by MDF unit.
Regarding depreciation, it should be around Rs 64 crore on consolidated basis.
Since Nov’21, the stock has corrected from a high of 240 to around current levels of 160.
Below, we have shared some projections for the Plywood and allied products business and the MDF business for FY 27.
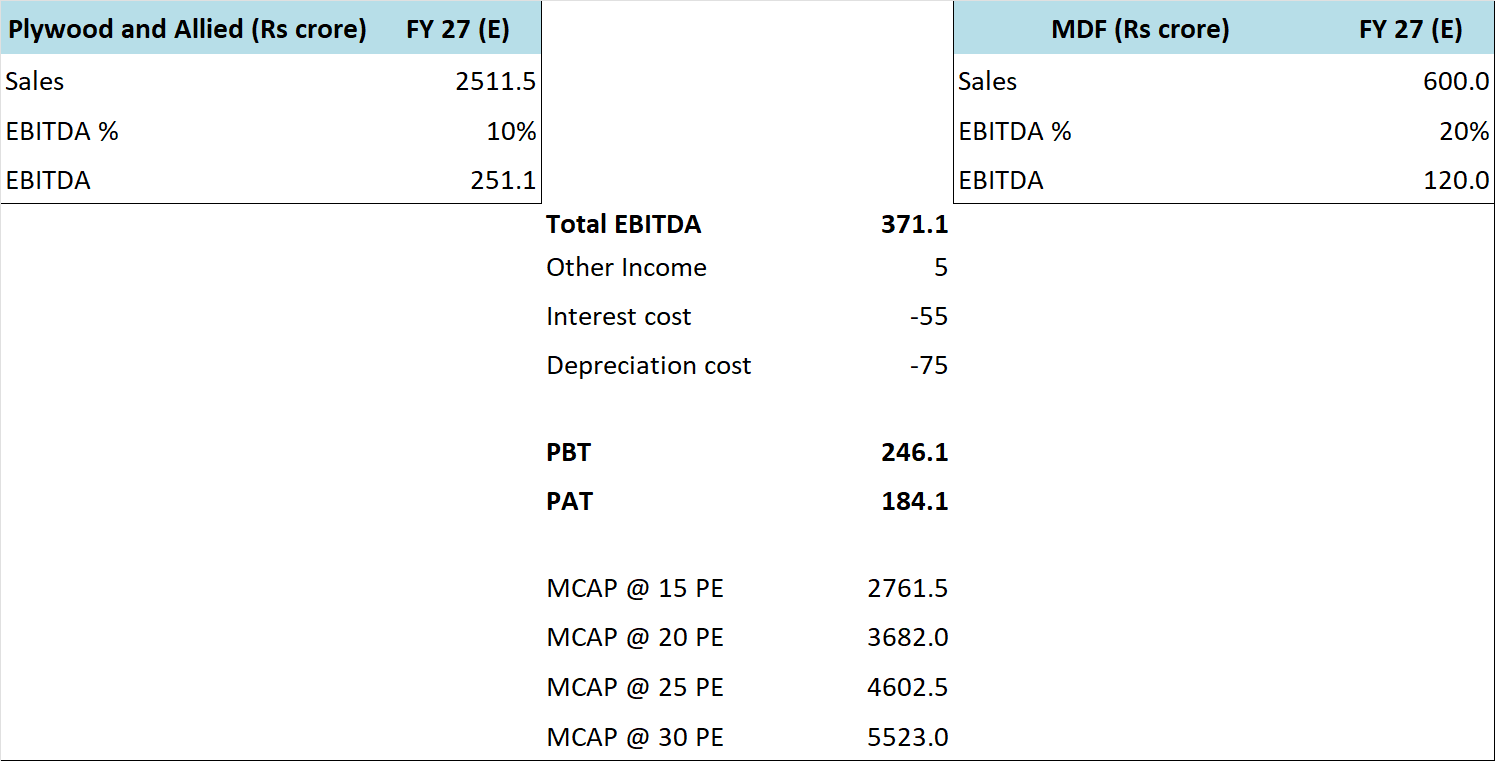
It is a well-known fact that projections rarely come true because they get influenced by the prevailing situation; however please find below some of our assumptions:
- We have assumed 8% CAGR for Plywood and allied products business and 10% EBITDA margins 4 years down the line
- For MDF, while the management expects full utilization by FY 26, we have assumed full utilization by FY 27 with blended realization of around Rs 25,000 per CBM and 20% EBITDA margins
- We have assumed Rs 55 crore interest cost for FY 27, even though it might be lower with repayment of debt related to MDF
We have also indicated market cap at various exit multiples. It is important to note here that over the last 8-9 years Greenply has consistently traded more than 15 times earnings.
Similarly, peers like Centuryply, Greenpanel also trade around 15-30 times earnings and around 2-4 times sales.
Risks/concerns
Our investment thesis incorporates assumptions about growth in both Plywood and MDF businesses; if the demand doesn’t grow at the expected rate or if the cut-throat competition results in price wars, the company might end up reporting much lower numbers than our expectations.
We have assumed exit multiples in the range of 15-30. In case the market attributes lower valuations to the business, the returns will fall flat.
Disclosure: I don’t have any investment in Greenply Industries and have not traded in the stock in the last 30 days.
Best Regards,
Ekansh Mittal
Research Analyst
http://www.katalystwealth.com/
Ph.: +91-727-5050062, Mob: +91-9818866676
Email: [email protected]
Rating Interpretation
Positive – Expected return of ~15% + on annualized basis in medium to long term for investment recommendations and in short term for Special situations
Neutral – Expected Absolute return in the range of +/- 15%
Negative – Expected Absolute return of over -15%
Coverage closure – No further update on the stock
% weightage – allocation in the subject stock with respect to equity investments
Short term – Less than 1 year
Medium term – Greater than 1 year and less than 3 years
Long term – Greater than 3 years
Research Analyst Details
Name: Ekansh Mittal Email Id: [email protected] Ph: +91 727 5050062
Analyst ownership of the stock: No
Details of Associates: Not Applicable
Analyst Certification: The Analyst certify (ies) that the views expressed herein accurately reflect his (their) personal view(s) about the subject security (ies) and issuer(s) and that no part of his (their) compensation was, is or will be directly or indirectly related to the specific recommendation(s) or views contained in this research report.
Disclaimer: www.katalystwealth.com (here in referred to as Katalyst Wealth) is the domain owned by Ekansh Mittal. Mr. Ekansh Mittal is the sole proprietor of Mittal Consulting and offers independent equity research services to retail clients on subscription basis. SEBI (Research Analyst) Regulations 2014, Registration No. INH100001690
Address – 7, Panch Ratan, 7/128, Swaroop Nagar, Kanpur – 208002, Contact No. – +91-7275050062
Compliance Officer – Mr. Ekansh Mittal, +91-9818866676, [email protected]
Grievance Redressal – Mittal Consulting, [email protected], +91-9818866676, +91-7275050062
“Registration granted by SEBI and certification from NISM in no way guarantee performance of the intermediary or provide any assurance of returns to investors”.
Performance numbers do not include the impact of transaction fee and other related costs. Past performance does not guarantee future returns.
“Investment in securities market are subject to market risks. Read all the related documents carefully before investing.”
The views expressed are based solely on information available publicly and believed to be true. Investors are advised to independently evaluate the market conditions/risks involved before making any investment decision.
A graph of daily closing prices of securities is available at www.bseindia.com (Choose a company from the list on the browser and select the “three years” period in the price chart.
This report is for the personal information of the authorized recipient and does not construe to be any investment, legal or taxation advice to you. Ekansh Mittal/Mittal Consulting/Katalyst Wealth is not soliciting any action based upon it. This report is not for public distribution and has been furnished to you solely for your information and should not be reproduced or redistributed to any other person in any form. This document is provided for assistance only and is not intended to be and must not alone be taken as the basis for an investment decision. Ekansh Mittal or any of its affiliates or employees shall not be in any way responsible for any loss or damage that may arise to any person from any inadvertent error in the information contained in this report. Neither Ekansh Mittal, nor its employees, agents nor representatives shall be liable for any damages whether direct or indirect, incidental, special or consequential including lost revenue or lost profits that may arise from or in connection with the use of the information. Ekansh Mittal/Mittal Consulting or any of its affiliates or employees do not provide, at any time, any express or implied warranty of any kind, regarding any matter pertaining to this report, including without limitation the implied warranties of merchantability, fitness for a particular purpose, and non-infringement.
The recipients of this report should rely on their own investigations. Ekansh Mittal/Mittal Consulting and/or its affiliates and/or employees may have interests/ positions, financial or otherwise in the securities mentioned in this report. Mittal Consulting has incorporated adequate disclosures in this document. This should, however, not be treated as endorsement of the views expressed in the report.
We submit that no material disciplinary action has been taken on Ekansh Mittal by any regulatory authority impacting Equity Research Analysis.
Disclosure (SEBI RA Regulations)
Whether the research analyst or research entity or his associate or his relative has any financial interest in the subject company/companies and the nature of such financial interest – No
Whether the research analyst or research entity or his associates or his relatives have actual/beneficial ownership of 1% or more securities of the subject company (at the end of the month immediately preceding the date of publication of the research report or date of the public appearance) – No
Whether the research analyst or research entity or his associate or his relative has any other material conflict of interest at the time of publication of the research report or at the time of public appearance – No
Whether it or its associates have received any compensation from the subject company in the past twelve months – No
Whether it or its associates have managed or co-managed public offering of securities for the subject company in the past 12 months – No
Whether it or its associates have received any compensation for investment banking or merchant banking or brokerage services from the subject company in the past 12 months – No
Whether it or its associates have received any compensation for products or services other than investment banking or merchant banking or brokerage services from the subject company in the past 12 months – No
Whether the subject company is or was a client during twelve months preceding the date of distribution of the research report and the types of services provided – No
Whether the research analyst has served as an officer, director, or employee of the subject company – No
Whether the research analyst or research entity has been engaged in market making activity for the subject company – No