Dear Sir,
I hope you are doing good.
I know it’s not easy to be good considering the way the markets have been since the year and a half; however, we are writing this to share with you our views on the current market situation.
Well, nobody knows the future, however we strongly believe in the fact that one can take cues from history because though history doesn’t necessarily repeat the same way, it does rhyme.
Right now, most of the investors are concerned about the correction in the broader markets and the slowing economy.
To understand the current situation better, I think it’s important for us to understand that economy and markets move in cycles. There are periods of uptrend like 1991-92, 1993-94, 1999-2000, 2003-07, 2014-17 and similarly there are periods of downtrend like 1992-93, 2000-03, 2008, 2011-13 and now 2018-19.
Cycles are inevitable and largely driven by human psychology and behaviour.
To put it simply, greed and fear are the two major driving factors behind market cycles. Greed takes over investors psyche near market peaks and fear becomes widespread near market lows.
While it is difficult to accurately predict the top and bottom of the cycle, but we as investors can do significantly better by knowing where the cycle stands today.
Reading Buffett’s quotes like “Be greedy when others are fearful” is one thing and practicing them is another; however, as mentioned above, if we are able to determine the state of the markets, it becomes a bit easier to execute the saying.
So, how does one go about determining the state of the markets:
In our view the simplest way to determine the state of markets is by checking investor’s participation. As mentioned above, during the uptrend, greed sets in, there’s fear of missing out and as a result the investor participation increases.
Similarly, during market lows, fear takes over and the investor participation declines.
So, let’s check the current status of investor participation:
IPOs
Firstly, a good source for checking IPO (and other issues) related data is https://www.primedatabase.com/
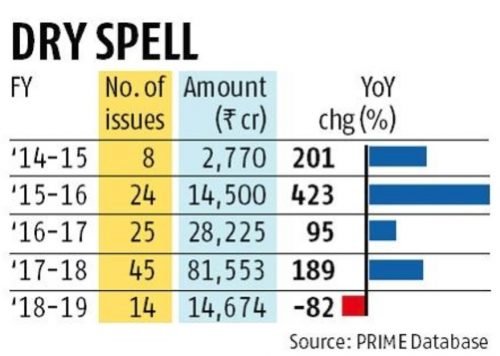
Now, as can be noticed above, in FY 19, the money raised through IPO dropped 82% in comparison to FY 18. Similarly, in FY 18, the money raised through IPO increased by 189% in comparison to FY 17.
The reasons behind increase and decrease in such values is quite basic.
Promoters come out with IPOs when they see the confluence of following two conditions:
- Higher investor participation so that their issue sails through and
- Higher valuations so that they can get more than what their shares are worth of
Thus, 82% drop in IPOs in FY 19 is indicative of both decline in valuations and lower investor participation.
Equity turnover data
You can check equity turnover data at the following link – https://www.bseindia.com/markets/keystatics/Keystat_turnoverequity.aspx?expandable=0
Towards the end of bull run, the second rung stocks start going up and similarly towards the end of bear market the participation in such stocks goes down significantly. Thus, in our view BSEs turnover data on B and other segment stocks is very helpful in determining the state of the market.
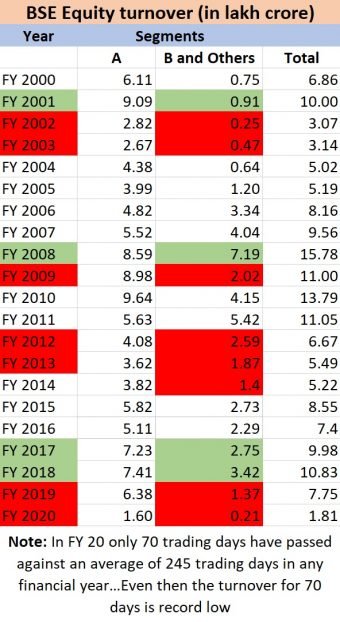
Now, as can be seen from the data shared above, FY 01, FY 08 and FY 18 marked the peaks of equity turnover and the same also coincided with the peaks of broader market.
Similarly, the turnover dropped significantly in FY 02, FY 03, FY 09, FY 12, FY 13 and coincided with market lows.
The turnover has again dropped significantly in FY 19 and FY 20 (70 trading days data) indicating that investors have again lost interest in the market. In fact, the drop-in turnover in FY 20 is quite significant indicating how fear has engulfed investor’s psychology.
Google trends: Multibagger stock
The above data can be checked at the following link – https://trends.google.com/trends/explore?date=2007-06-01%202019-07-14&geo=IN&q=%2Fg%2F11bwkdllch
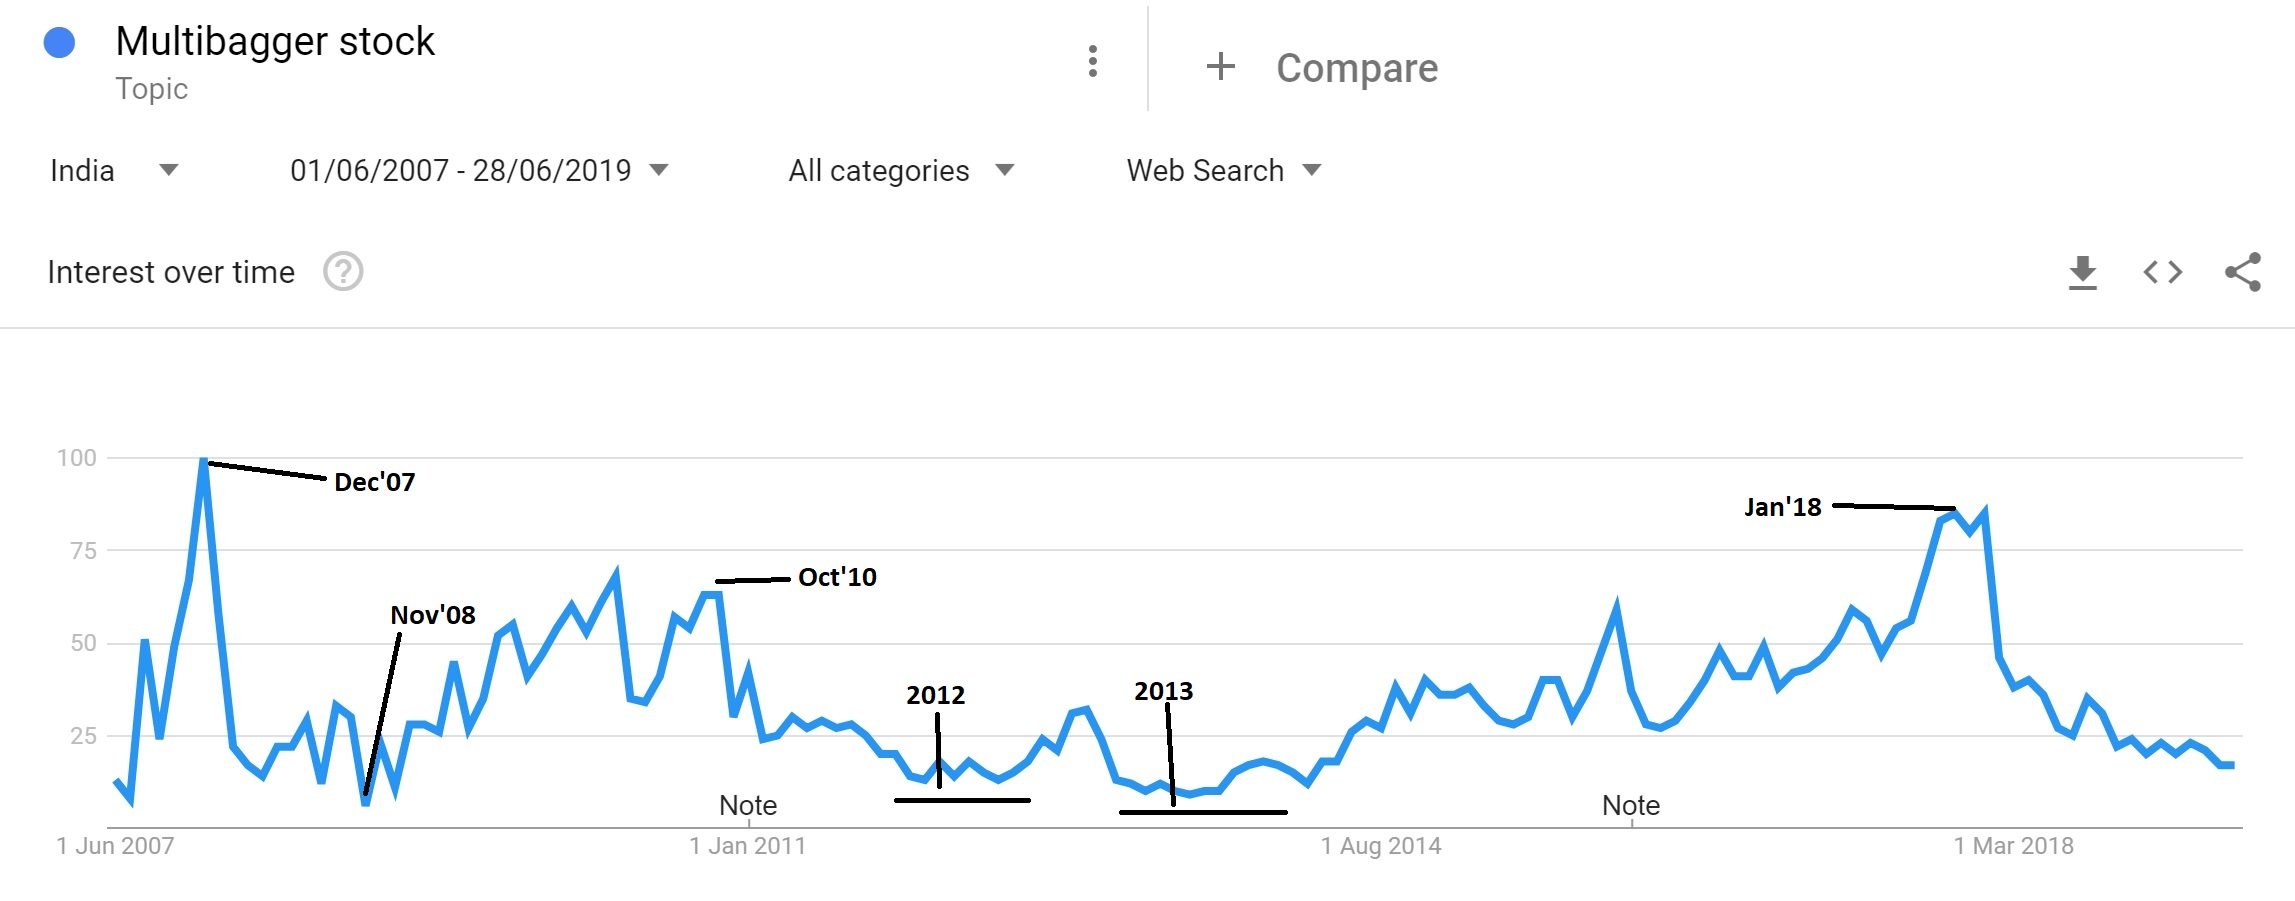
The above graph depicts investor participation (through google search for term “multibagger stock”) at various points of time.
While searching for this data, I didn’t imagine that it would capture the essence of greed and fear and the performance of the broader markets so beautifully.
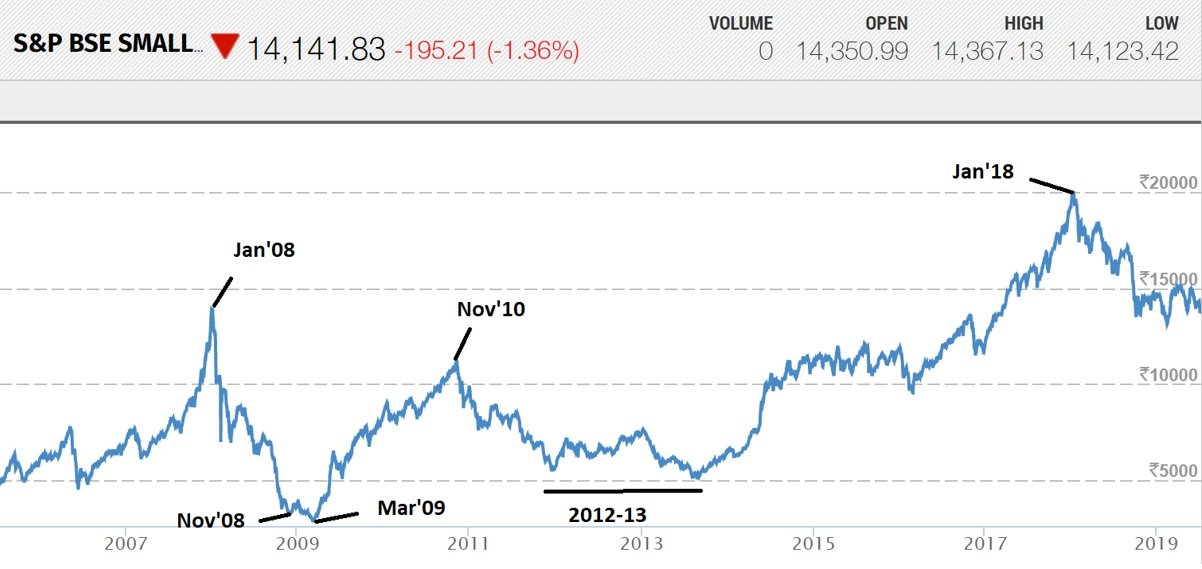
In the above sections, we have talked about how markets peaked in Jan’08, Oct’10 and Jan’18 and similarly the bottom formation in early 2009, 2012 and 2013. What’s amazing is that investor participation also peaked and bottomed around the same time.
What is also interesting to note is that as of Jul’19 the investor participation is near the lows of 2008-09, 2012 and 2013.
Conclusion – On Combining the data on IPOs, Equity turnover and Google search for Multibagger stocks, we can infer the following:
- Market follows a cyclical pattern; peaks are followed by lows and vice-versa
- Investor participation is highest (Greed) closer to market peaks and lowest (Fear) around market lows
- Currently, investor participation is approaching record lows (Fear)
I think it wouldn’t be wrong to conclude that market bottom is probably closer than ever and surely a good time to be greedy than fearful.
We also believe that as the economy is slow, the market may not have a v-shaped recovery and could grind around like 2001-03 or 2012-13.
Even if one finds it difficult to be greedy, I think it’s very important to be not fearful and remain invested in the market because lows are followed by recovery and peaks.
[bctt tweet=”Market outlook: Are we close to the bottom or is there more downside?” username=”katalystwealth”]
Best Regards,
Ekansh Mittal
Research Analyst
Web: https://katalystwealth.com/
Email: [email protected]