Dear Sir,
While Google has proved to be extremely helpful to mankind, it’s difficult to believe that it can even help in determining the market tops and bottoms.
However, it indeed helps.
We are in fact disappointed that we added this tool only recently to our repertoire for determining the market excesses on both the sides. However, it’s never too late to have extra tools at your disposal and we are happy to share the same with you as well.
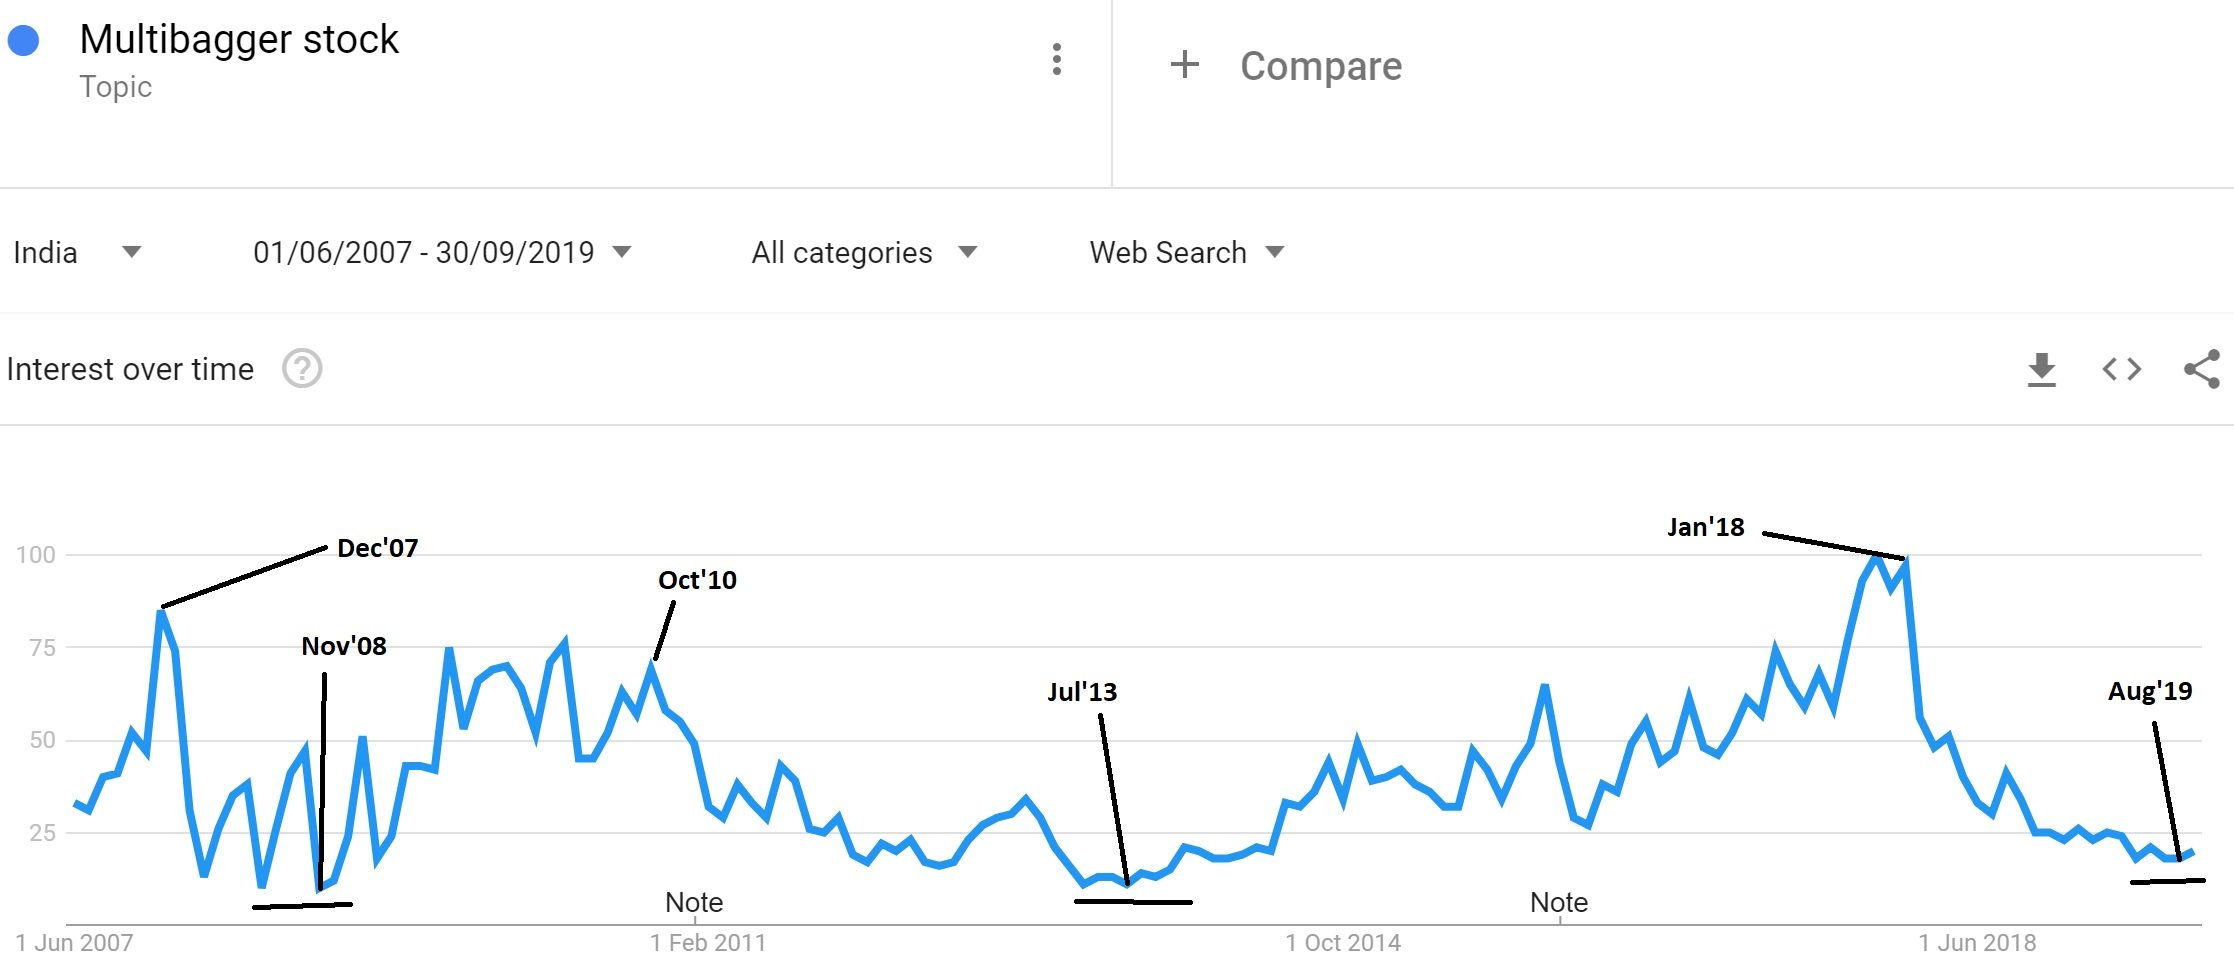
Below is a graph from Google trends for the search term “Multibagger stocks”.

The above data can be checked at the following link – https://trends.google.com/trends/explore?date=2007-06-01%202019-09-30&geo=IN&q=%2Fg%2F11bwkdllch
The above graph depicts investor participation (through google search for term “Multibagger Stock”) at various points of time.
While searching for this data, we didn’t imagine that it would capture the tops and bottoms of the broader markets so beautifully.
As we all know, markets topped out in Jan’08, Oct’10 and Jan’18 and what is interesting to note that even the Google Trends graph (for search term “Multibagger stocks”) topped out in Dec’07, Oct’10 and Jan’18.
Similarly, the markets formed a bottom around late 2008 and mid 2013 and Google trends graph also bottomed around same levels.
What is interesting to note is that since forming the top in Jan’18, the Google trends graph is now closer to lows of Nov’08 and 2013.
Why is this Graph important?
The Graph seems to have worked well in the past and we believe it will continue to work well for foreseeable future (unless people start using another search engine). It basically captures the essence of well known saying in the market “When even the Panwala starts recommending stocks, it’s time to come out of the markets”
The Google Trends graph basically indicates (in relative terms) the interest in stock markets and unfortunately investors get interested near the market tops and vice-versa near the market lows.
The Moot question – Have the markets bottomed out?
Before we go into prediction mode, let’s just look at some important facts:
- Oil and commodity prices are trending downwards – Good for the economy
- We have had a good monsoon season – Good for the economy
- Corporate tax rates have been slashed – Seemingly Good for the economy
- Bank and NBFC problems getting recognized
- Investor Participation and Consumer Confidence (as per RBIs survey) near record lows
While we don’t expect a V-shaped recovery, based on the above facts and looking at the charts, we think it wouldn’t be wrong to conclude that markets may have already started the process of bottoming out or are much-much closer to the bottom.
The base formation can continue for 6 months or a year, but the least we can do is remain invested (while obviously churning the portfolio, if needed) and show some greediness like we do during Big Billion Day Sale or Amazon Festival.
Happy Investing.
Best Regards,
Ekansh Mittal
Research Analyst
Web: https://katalystwealth.com/
Email: [email protected]