Hello Sir,
Hope you are doing well.
Today, I am going to share with you our views on how to invest in cyclical businesses so that next time you don’t get trapped at the very peak and rather invest when the cycle is down for good gains in subsequent periods.
Let me begin by sharing with you a 10 + years stock chart of a cyclical company – Indian Metals and Ferro Alloys.
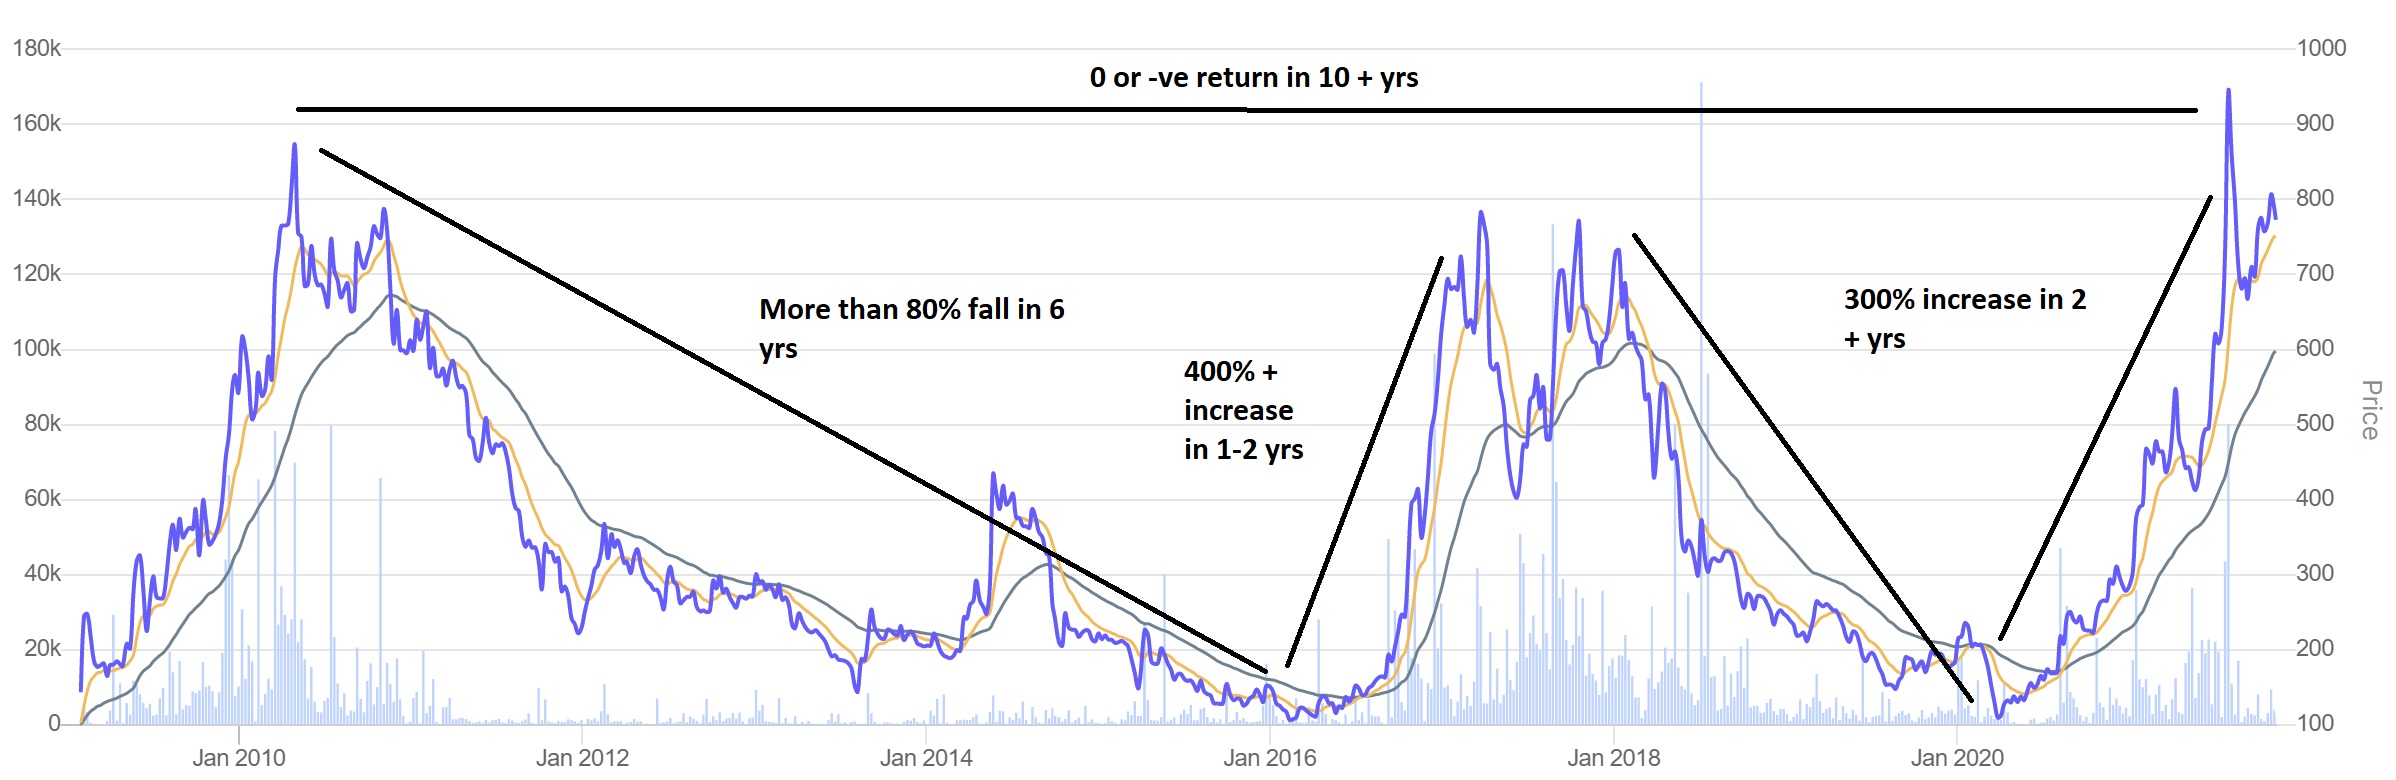
As you can notice, it’s a same company but different outcomes for different investors:
- 0 return for someone who invested at the peak of 2010
- 80% loss for someone who invested at the peak and sold around 2015-16
- 400-700% + gain in a matter of 1-1.5 years who invested at the lows of 2016 or 2019-20
It is normally believed that cyclical companies are bad from investment viewpoint. We too used to believe the same, until we realized that they are bad if picked up at the peak, but the same cyclical business can deliver great returns and in a relatively shorter duration if picked near the lows, i.e., when the business cycle is down.
I have shared the above chart so that you can see that there’s a clear pattern of stock making a quick 300-700% rise followed by a slow grinding 70-80% fall.
Question is how can we capture this 300-700% move.
Now, let me share with you the Profit/loss numbers of the company. The idea is to recognize patterns in both the P/L numbers and the stock price and use them to your advantage to buy the stock at lows.
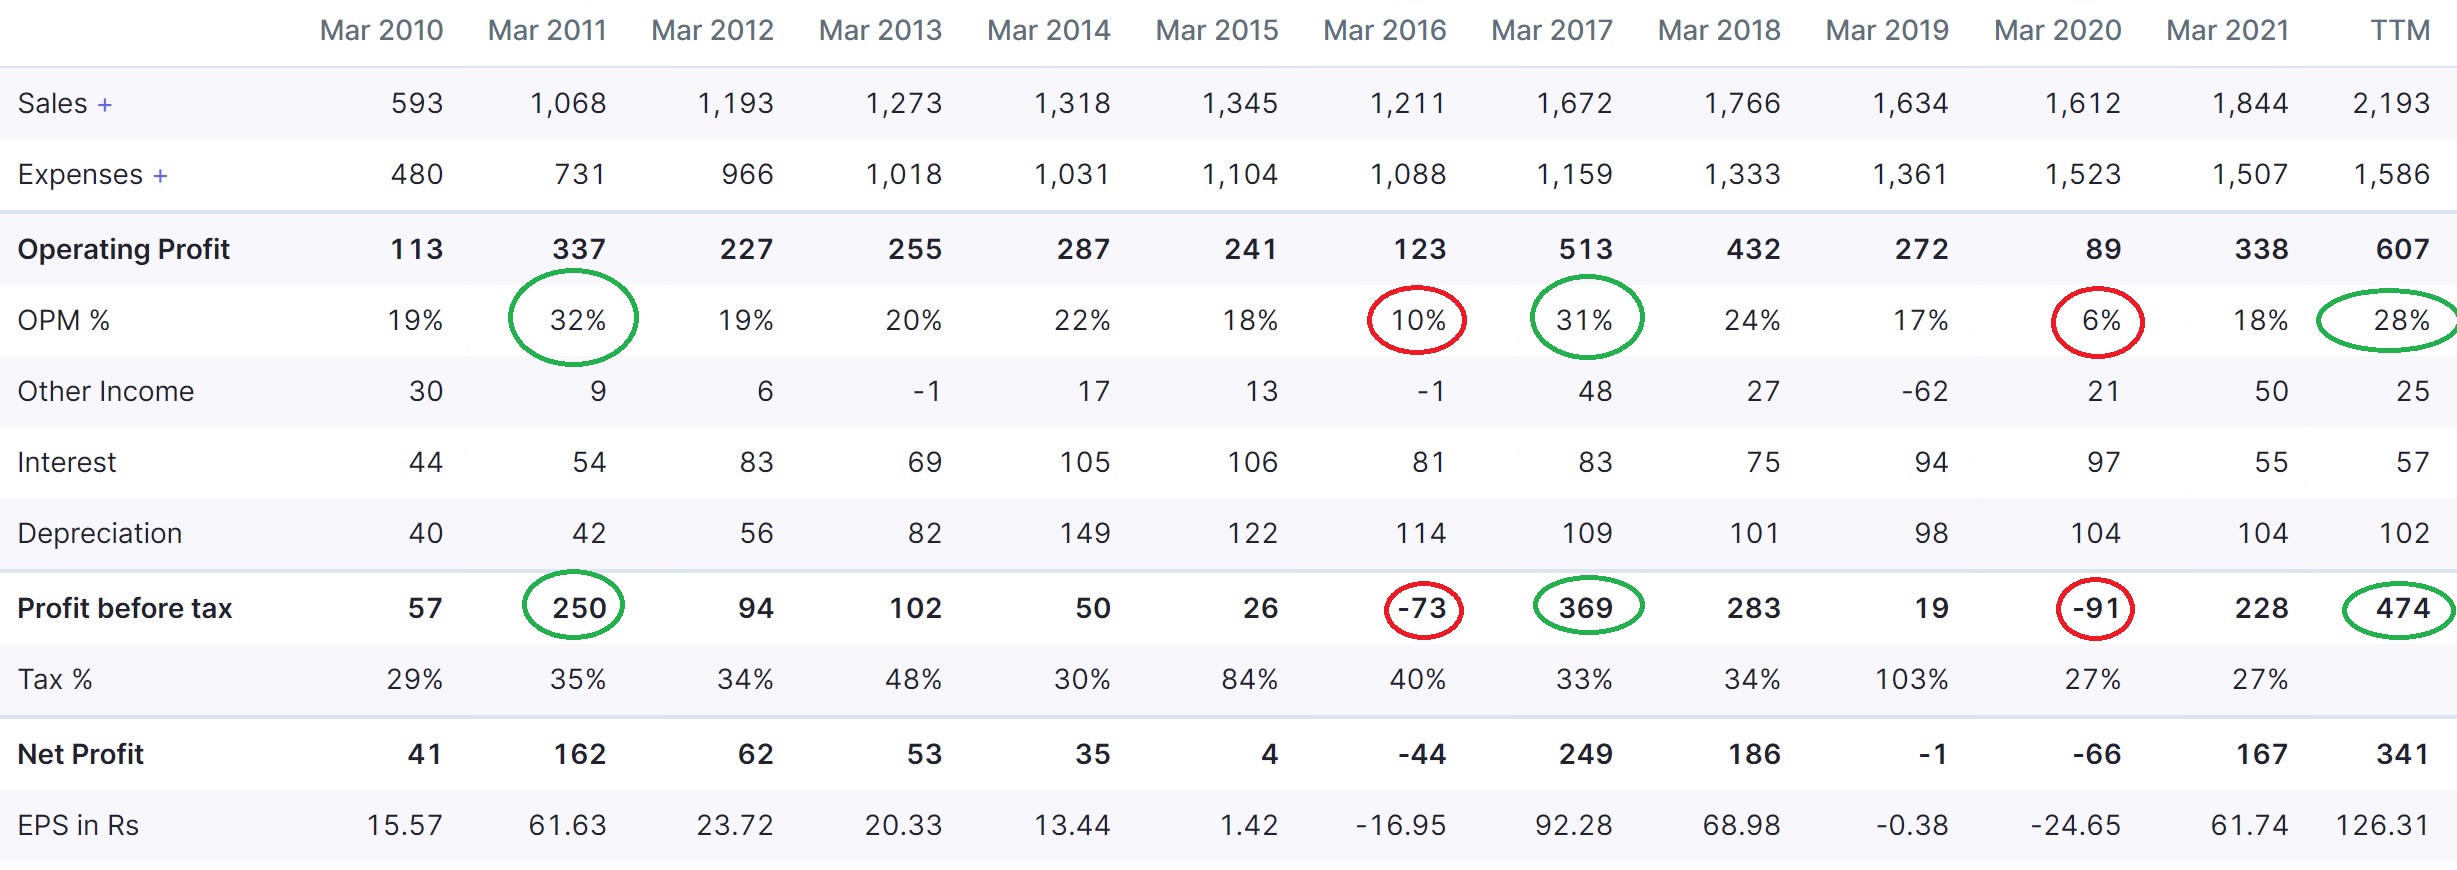
In the P/L numbers, I have circled years of high profitability with green colour and years of low margins and losses with red colour.
Cycle #1 – So, the company reported highest OPM of 32% in FY 11 and the stock also made its first peak of ~800 odd levels in Apr’10 and Nov’10, i.e., FY 11.
Subsequently, the margins started declining with the company recording lowest EBITDA margins of 10% in FY 16 and also reported losses at before tax level. The stock also recorded its low of 110 around the same period in Feb’16.
Cycle #2 – After recording the worst performance in FY 16, the company bounced back and again recorded peak margins of 30% + and highest ever PBT of 369 crore a year later in FY 17. As was expected, the stock appreciated by 600% + and recorded its 2nd peak of ~780 in Mar’17.
A similar down cycle played out till FY 20 when the company recorded worst ever EBITDA margins of 6% and loss before tax of 91 crore. Worst margins also coincided with the stock falling to the lows of 110 in Mar’20.
Cycle #3 – Being a cyclical business, the company’s performance has improved again with the EBITDA margins improving to 28% + and the company recording highest ever PBT of 474 crore. The stock has also appreciated from the lows of 110 to 800-900 odd levels and that too in a matter of 18-20 months.
Conclusion – Normally investors don’t pay much attention to the nature of business; however, if you want to be a successful investor, it’s so very important to understand if the business is low cyclical like FMCG, Pharma; moderately cyclical like banks, auto; or deeply cyclical like metals, commodity chemicals, etc.
In deeply cyclical and moderately cyclical companies, the best time to invest is not when the business performance is great. Rather, as illustrated in the example above, periods of bad performance, losses by the company can throw up much better investment opportunities with low downside and significantly higher upside.
One important metric that we track for such companies is margins, both gross and operating margins. In deeply cyclical businesses, margins tend to swing from one extreme to another. In general, periods of low margins tend to throw up good investment opportunities.
At the same time, selling the stock with deterioration in margins, profitability is equally important because after rising 400-800% or more, such stocks can fall by 60-80%.
NALCO example – Making use of the cyclical patterns, we recommended National Aluminium to our Premium Members around 28-28.50 odd levels on 9th May’20 and currently the stock is trading around 100-105 odd levels. The company has also paid Rs 3.5/- per share dividend in the interim. To understand, how we made use of the cyclicality, you can read the detailed Investment Report (Free access) on National Aluminium at the following LINK
If you are looking for such investment opportunities do check out our premium subscriptions.
Disclaimer: National Aluminium has been recommended to members and I have personal investment in the same. Indian Metals and Ferro Alloys has only been used as an example for education purpose. It’s not a recommendation to buy/sell the stock.
Best Regards,
Ekansh Mittal
Research Analyst
Web: https://www.
SEBI Research Analyst Registration No. INH100001690
Research Analyst Details
Name: Ekansh Mittal Email Id: [email protected]
Disclosure (SEBI RA Regulations)
Whether the research analyst or research entity or his associate or his relative has any financial interest in the subject company/companies and the nature of such financial interest – Yes, in National Aluminium
Whether the research analyst or research entity or his associates or his relatives have actual/beneficial ownership of 1% or more securities of the subject company (at the end of the month immediately preceding the date of publication of the research report or date of the public appearance) – No
Whether the research analyst or research entity or his associate or his relative has any other material conflict of interest at the time of publication of the research report or at the time of public appearance – No
Whether it or its associates have received any compensation from the subject company in the past twelve months – No
Whether it or its associates have managed or co-managed public offering of securities for the subject company in the past 12 months – No
Whether it or its associates have received any compensation for investment banking or merchant banking or brokerage services from the subject company in the past 12 months – No
Whether it or its associates have received any compensation for products or services other than investment banking or merchant banking or brokerage services from the subject company in the past 12 months – No
Whether the subject company is or was a client during twelve months preceding the date of distribution of the research report and the types of services provided – No
Whether the research analyst has served as an officer, director or employee of the subject company – No
Whether the research analyst or research entity has been engaged in market making activity for the subject company – No
Disclaimer: You can access it here - LINK