Hello Sir,
Hope you are doing well.
A lot of highly cyclical stocks including metal stocks are down 20-30% from their recent top. Our suggestion would be, don't start finding value in them based on low PEs.
Unless there's a sustained rise in commodity prices, we believe, some sectors may have already reported peak profitability for a very long time to come and the PEs may start expanding or even turn negative in few years.
To understand how to invest in cyclical stocks, I am going to share with you an example so that next time you don’t get trapped at the very peak and rather invest when the cycle is down for good gains in subsequent periods.
Before that, in this market correction, if you are interested in investing in a Pharmaceutical company which has made an extremely complex and poisonous material from scratch (with a worldwide market potential of Rs 27,000 crore +) and is the only Indian maker, you can read about it here - LINK
Let me begin by sharing with you a 10 + years stock chart of a cyclical company – Indian Metals and Ferro Alloys.
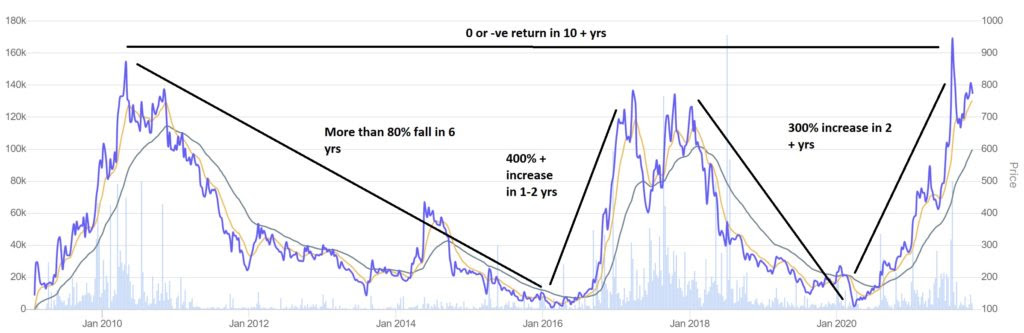
As you can notice, it’s a same company but different outcomes for different investors:
- 0 return for someone who invested at the peak of 2010
- 80% loss for someone who invested at the peak and sold around 2015-16
- 400-700% + gain in a matter of 1-1.5 years who invested at the lows of 2016 or 2019-20
It is normally believed that cyclical companies are bad from investment viewpoint. We too used to believe the same, until we realized that they are bad if picked up at the peak, but the same cyclical business can deliver great returns and in a relatively shorter duration if picked near the lows, i.e., when the business cycle is down.
I have shared the above chart so that you can see that there’s a clear pattern of stock making a quick 300-700% rise followed by a slow grinding 70-80% fall.
Question is how can we capture this 300-700% move and how to avoid 70-80% fall?
Now, let me share with you the Profit/loss numbers of the company. The idea is to recognize patterns in both the P/L numbers and the stock price and use them to your advantage to buy the stock at lows.

In the P/L numbers, I have circled years of high profitability with green colour and years of low margins and losses with red colour.
Cycle #1 – So, the company reported highest OPM of 32% in FY 11 and the stock also made its first peak of ~800 odd levels in Apr’10 and Nov’10, i.e., FY 11.
Subsequently, the margins started declining with the company recording lowest EBITDA margins of 10% in FY 16 and also reported losses at before tax level. The stock also recorded its low of 110 around the same period in Feb’16.
Cycle #2 – After recording the worst performance in FY 16, the company bounced back and again recorded peak margins of 30% + and highest ever PBT of 369 crore a year later in FY 17. As was expected, the stock appreciated by 600% + and recorded its 2nd peak of ~780 in Mar’17.
A similar down cycle played out till FY 20 when the company recorded worst ever EBITDA margins of 6% and loss before tax of 91 crore. Worst margins also coincided with the stock falling to the lows of 110 in Mar’20.
Cycle #3 – Being a cyclical business, the company’s performance has improved again with the EBITDA margins improving to 28% + and the company recording highest ever PBT of 474 crore. The stock has also appreciated from the lows of 110 to 800-900 odd levels and that too in a matter of 18-20 months.
Conclusion – Normally investors don’t pay much attention to the nature of business; however, if you want to be a successful investor, it’s so very important to understand if the business is low cyclical like FMCG, Pharma; moderately cyclical like banks, auto; or deeply cyclical like metals, commodity chemicals, etc.
In deeply cyclical and moderately cyclical companies, the best time to invest is not when the business performance is great. Rather, as illustrated in the example above, periods of bad performance, losses by the company can throw up much better investment opportunities with low downside and significantly higher upside.
One important metric that we track for such companies is margins, both gross and operating margins. In deeply cyclical businesses, margins tend to swing from one extreme to another. In general, periods of low margins tend to throw up good investment opportunities.
At the same time, selling the stock with deterioration in margins, profitability is equally important because after rising 400-800% or more, such stocks can fall by 60-80%.
If you are looking for investment opportunities do check out our premium subscriptions. We have been helping our clients with our stock research for over a decade now.
Disclaimer: Indian Metals and Ferro Alloys has only been used as an example for education purpose. It’s not a recommendation to buy/sell the stock nor do we have any coverage on the same.
Best Regards,
Ekansh Mittal
Research Analyst
Web: https://www.katalystwealth.
SEBI Research Analyst Registration No. INH100001690
Research Analyst Details
Name: Ekansh Mittal Email Id: [email protected] Ph: +91 727 5050062
Details of Associate: Not Applicable
Analyst Certification: The Analyst certify (ies) that the views expressed herein accurately reflect his (their) personal view(s) about the subject security (ies) and issuer(s) and that no part of his (their) compensation was, is or will be directly or indirectly related to the specific recommendation(s) or views contained in this research report.
Disclaimer: https://www.
The views expressed are based solely on information available publicly and believed to be true. Investors are advised to independently evaluate the market conditions/risks involved before making any investment decision
This report is for the personal information of the authorized recipient and does not construe to be any investment, legal or taxation advice to you. Ekansh Mittal/Mittal Consulting/Katalyst Wealth is not soliciting any action based upon it. This report is not for public distribution and has been furnished to you solely for your information and should not be reproduced or redistributed to any other person in any form. This document is provided for assistance only and is not intended to be and must not alone be taken as the basis for an investment decision. Ekansh Mittal or any of its affiliates or employees shall not be in any way responsible for any loss or damage that may arise to any person from any inadvertent error in the information contained in this report. Neither Ekansh Mittal, nor its employees, agents nor representatives shall be liable for any damages whether direct or indirect, incidental, special or consequential including lost revenue or lost profits that may arise from or in connection with the use of the information. Ekansh Mittal/Mittal Consulting or any of its affiliates or employees do not provide, at any time, any express or implied warranty of any kind, regarding any matter pertaining to this report, including without limitation the implied warranties of merchantability, fitness for a particular purpose, and non-infringement.
The recipients of this report should rely on their own investigations. Ekansh Mittal/Mittal Consulting and/or its affiliates and/or employees may have interests/ positions, financial or otherwise in the securities mentioned in this report. Mittal Consulting has incorporated adequate disclosures in this document. This should, however, not be treated as endorsement of the views expressed in the report.
We submit that no material disciplinary action has been taken on Ekansh Mittal by any regulatory authority impacting Equity Research Analysis.
Disclaimer: You can access it here - LINK
Disclosure (SEBI RA Regulations)
Whether the research analyst or research entity or his associate or his relative has any financial interest in the subject company/companies and the nature of such financial interest – No
Whether the research analyst or research entity or his associates or his relatives have actual/beneficial ownership of 1% or more securities of the subject company (at the end of the month immediately preceding the date of publication of the research report or date of the public appearance) – No
Whether the research analyst or research entity or his associate or his relative has any other material conflict of interest at the time of publication of the research report or at the time of public appearance – No
Whether it or its associates have received any compensation from the subject company in the past twelve months – No
Whether it or its associates have managed or co-managed public offering of securities for the subject company in the past 12 months – No
Whether it or its associates have received any compensation for investment banking or merchant banking or brokerage services from the subject company in the past 12 months – No
Whether it or its associates have received any compensation for products or services other than investment banking or merchant banking or brokerage services from the subject company in the past 12 months – No
Whether the subject company is or was a client during twelve months preceding the date of distribution of the research report and the types of services provided – No
Whether the research analyst has served as an officer, director or employee of the subject company – No
Whether the research analyst or research entity has been engaged in market making activity for the subject company – No