Control Print has been a long-tracked name for us. We recommended the stock to our (opens in new tab)Premium Members in 2014 at around Rs 55 levels and exited coverage in 2024 at roughly Rs 800 levels. Over this period, the company also returned Rs 60+ per share through dividends, underlining the role of steady cash flows in long-term compounding.
Recently, Control Print reported a steady operating performance in Q3 and 9M FY26, supported by growth in its core coding & marking business and improved profitability at the standalone level.
Below is a detailed, factual summary, covering financial performance, business mix, installed base, overseas operations, employee cost impact, and technology commentary.
Help us grow: If you think our stock recommendations could add value to your friends, relatives, or acquaintances, we’d appreciate you spreading the word about Katalyst Wealth.
Before that: Here’s the list of new recommendations released by us in last few weeks
- For Insider Bets members – On 22nd Jan’26, we released our New stock report under “(opens in new tab)Insider Bets“ subscription. It’s a rare setup wherein Promoter is increasing stake via open market + preferential allotment, Valuations very reasonable at <10x earnings | <1x book and Earnings growth strong at 15%+ CAGR. You can access it by signing up (opens in new tab)HERE
- For Alpha/Alpha + members – On 31st Dec’25, we released a new long term investment recommendation for (opens in new tab)Alpha and Alpha + members. It’s a specialty products company which has delivered 20% + Sales and PAT CAGR, is net debt free, trading at attractive valuations with Price to Book value at 5 years low. You can access it by signing up (opens in new tab)HERE
Control Print Q3 & 9M FY26: Earnings Update, Margins, and Business Mix

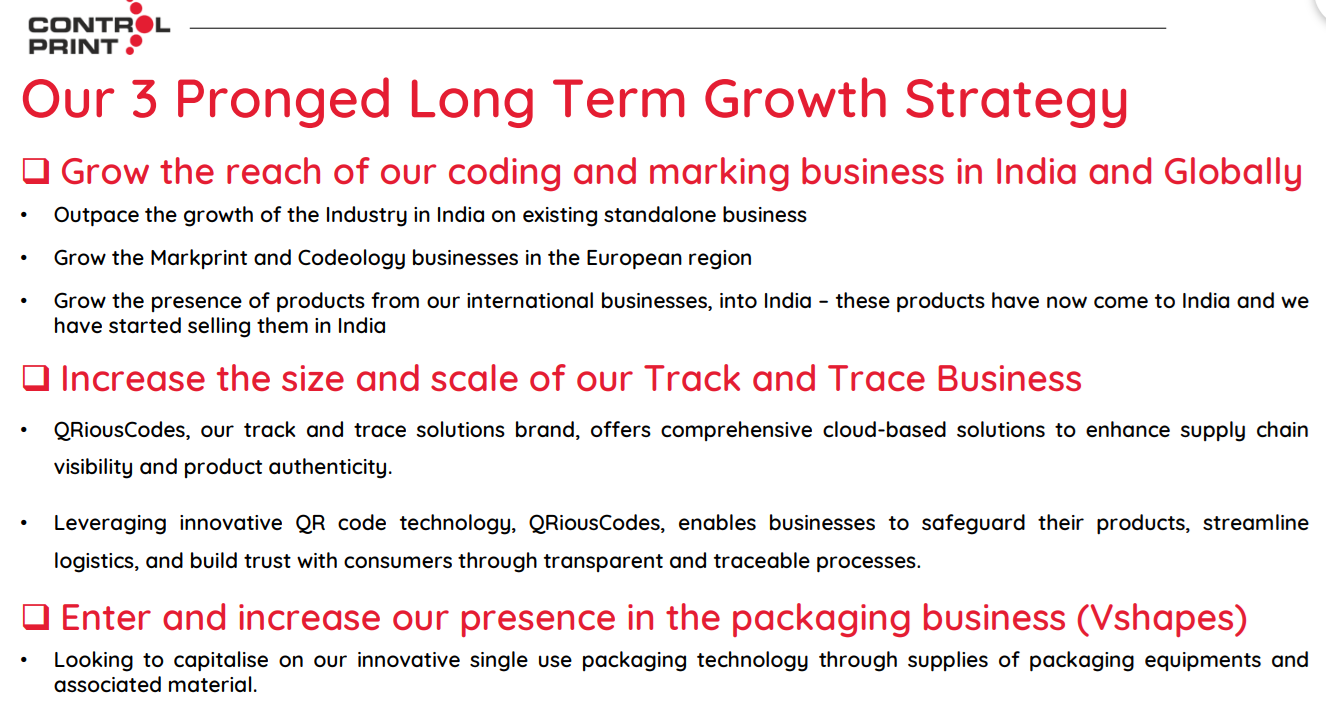
Source: Control Print presentation
Financial Performance – Standalone
Revenue
- Q3 FY26 operating revenue: ₹109 crore
- Q3 FY25: ₹94 crore
Profitability
- EBITDA growth: 21% YoY
- PBT (excluding exceptional items): 35% YoY growth
- PAT growth: 19% YoY, lower due to higher tax provisioning
Cost Structure (Q3 FY26)
- Cost of goods sold: ~41% of operating revenue
- Comparable with FY25 average (~42%)
- Manufacturing cost: ~2%
- Employee cost: 19% (Q2: 16%, Q1: 18%)
- Depreciation: ~4%
- Other expenses: ~14% (historically 13–14%)
Business Mix & Segment Details
Coding & Marking
- Contributes ~92% of total revenue
- Key industries:
- Pipes, food, healthcare, dairy, steel & metal, cable & wire
- Market leadership mentioned in:
- Cement, plywood, sugar, dairy
- Printer sales (9M FY26): ~2,100 units
- Installed base: ~22,000+ printers
- Revenue breakup within coding & marking (Q3):
- Printers: 18%
- Consumables: 58%
- Spares: 7%
- Services: 15%
Track & Trace
- Management indicated continued traction
- Business is compliance-driven, especially in pharmaceuticals
- Focus shifting from compliance-only solutions to data-driven intelligence layers
- Two large pilots mentioned to be in commercial finalisation stage
Packaging (V-Shapes)
- Machines installed in India and Italy
- Execution delays due to:
- Machine refinement
- Quality control and reliability enhancements
- Co-packaging activity gaining traction
- Issues highlighted:
- Small batch complexity
- Long lead times for reverse printing and lamination
- Supply chain and turnaround processes being streamlined
Safety Division
- Mask business restructured into broader safety division
- Products sold include:
- Masks, helmets, hard hats, gloves, ARC flash shoes, blankets
Overseas Subsidiaries & Consolidated Performance
Italy (Packaging Business)
- Main source of consolidated losses
- Delays due to:
- Machine redesign
- Quality validation
- Factory acceptance testing
- R&D costs expensed fully in Italy (~€0.8 million)
- Management stated:
- Technology developed benefits global operations
- Losses expected to reduce as execution improves
- Targeting breakeven around Q4 FY26 / Q1 FY27
UK (Codeology)
- Slightly profitable
- Losses attributed to:
- Market slowdown
- Investments in packaging and co-packaging setup
Markprint
- Profitable but sub-scale
- Management stated scope exists to improve scale
Margins, Costs & Labour Code Impact
Employee Costs
- Increase attributed to:
- Gratuity provisions under new labour codes
- Incentive provisioning
- Management indicated:
- One-time adjustment elements
- Increase estimated at ~₹5 crore
- New labour code effective from 21 Nov 2025
Other Expenses
- Increase due to:
- Travel
- Business promotion
- Management stated cost optimisation measures are underway
Capacity, Capex & Cash Flows
- Current capacity utilisation: ~65–70%
- Peak utilisation: ~85–90% (industry standard)
- No major capex planned for core coding & marking
- R&D expenses fully expensed
- Maintenance capex broadly aligned with depreciation
- Dividend payout: ~₹15 crore annually (as referenced in Q&A)
Market Outlook & Growth Commentary (Factual)
- Coding & marking industry growth expectation:
- ~10–12%
- Company growth expectation (near-term):
- ~15% if product edge sustains
- Track & trace demand remains compliance-led
- India–EU FTA:
- Management stated no material impact on competitive dynamics
Hope you found the blog post useful and it added value to your investment decisions. Sign up for more interesting stock ideas and industry notes.
Disclaimer: This is not a recommendation to buy/sell any of the stocks mentioned above. The securities quoted are for illustration only and are not recommendatory.
Ekansh Mittal
Research Analyst
Web: (opens in new tab)https://www.katalystwealth.
SEBI Research Analyst Registration No. INH100001690
Research Analyst Details
Name: Ekansh Mittal Email Id: (opens in new tab)[email protected] Ph: +91 727 5050062
Details of Associate: Not Applicable
Analyst Certification: The Analyst certify (ies) that the views expressed herein accurately reflect his (their) personal view(s) about the subject security (ies) and issuer(s) and that no part of his (their) compensation was, is or will be directly or indirectly related to the specific recommendation(s) or views contained in this research report.
Disclaimer: (opens in new tab)http://www.
Registered Address – 7, Panch Ratan, 7/128, Swaroop Nagar, Kanpur – 208002
Place of Business – 205, Ratan Floor, 113/120, Swaroop Nagar, Kanpur – 208002
Compliance Officer/Grievance Redressal – Mr. Ekansh Mittal, +91-9818866676, (opens in new tab)info@
“Registration granted by SEBI and certification from NISM in no way guarantee performance of the intermediary or provide any assurance of returns to investors”.
“Investment in securities market are subject to market risks. Read all the related documents carefully before investing.”
The views expressed are based solely on information available publicly and believed to be true. Investors are advised to independently evaluate the market conditions/risks involved before making any investment decision
This report is for the personal information of the authorized recipient and does not construe to be any investment, legal or taxation advice to you. Ekansh Mittal/Mittal Consulting/Katalyst Wealth is not soliciting any action based upon it. This report is not for public distribution and has been furnished to you solely for your information and should not be reproduced or redistributed to any other person in any form. This document is provided for assistance only and is not intended to be and must not alone be taken as the basis for an investment decision. Ekansh Mittal or any of its affiliates or employees shall not be in any way responsible for any loss or damage that may arise to any person from any inadvertent error in the information contained in this report. Neither Ekansh Mittal, nor its employees, agents nor representatives shall be liable for any damages whether direct or indirect, incidental, special or consequential including lost revenue or lost profits that may arise from or in connection with the use of the information. Ekansh Mittal/Mittal Consulting or any of its affiliates or employees do not provide, at any time, any express or implied warranty of any kind, regarding any matter pertaining to this report, including without limitation the implied warranties of merchantability, fitness for a particular purpose, and non-infringement.
The recipients of this report should rely on their own investigations. Ekansh Mittal/Mittal Consulting and/or its affiliates and/or employees may have interests/ positions, financial or otherwise in the securities mentioned in this report. Mittal Consulting has incorporated adequate disclosures in this document. This should, however, not be treated as endorsement of the views expressed in the report.
We submit that no material disciplinary action has been taken on Ekansh Mittal by any regulatory authority impacting Equity Research Analysis.
Use of Artificial Intelligence: RA may infrequently use Artificial Intelligence (AI) tools like chatgpt, notebooklm, etc. in its research services to enhance the quality and efficiency of the recommendations provided to clients. The tools are primarily used for data collection and generating con-call summaries for the purpose of research.
In accordance with Regulation 24(7) of the SEBI (Research Analyst) Regulations, 2014: We take full responsibility for the security, confidentiality, and integrity of client data used in conjunction with AI tools and we ensure compliance with applicable laws regarding the use of AI tools.
Disclaimer: You can access it here – (opens in new tab)LINK
Whether the research analyst or research entity or his associate or his relative has any financial interest in the subject company/companies and the nature of such financial interest – No
Whether the research analyst or research entity or his associates or his relatives have actual/beneficial ownership of 1% or more securities of the subject company (at the end of the month immediately preceding the date of publication of the research report or date of the public appearance) – No
Whether the research analyst or research entity or his associate or his relative has any other material conflict of interest at the time of publication of the research report or at the time of public appearance – No
Whether it or its associates have received any compensation from the subject company in the past twelve months – No
Whether it or its associates have managed or co-managed public offering of securities for the subject company in the past 12 months – No
Whether it or its associates have received any compensation for investment banking or merchant banking or brokerage services from the subject company in the past 12 months – No
Whether it or its associates have received any compensation for products or services other than investment banking or merchant banking or brokerage services from the subject company in the past 12 months – No
Whether the subject company is or was a client during twelve months preceding the date of distribution of the research report and the types of services provided – No
Whether the research analyst has served as an officer, director or employee of the subject company – No
Whether the research analyst or research entity has been engaged in market making activity for the subject company – No