I want to share something unusual with you today — a contrarian indicator I’ve been tracking for years that has an almost perfect track record of calling market tops and bottoms.
It’s not a technical indicator. It’s not fund flow data. It’s not insider buying.
It’s Google search trends.
Specifically: How often retail investors in India search for the term “Multibagger stock.”
Let me show you what 19 years of data reveals — and what it’s telling us right now in February 2026.
The Pattern That Repeats Every Cycle
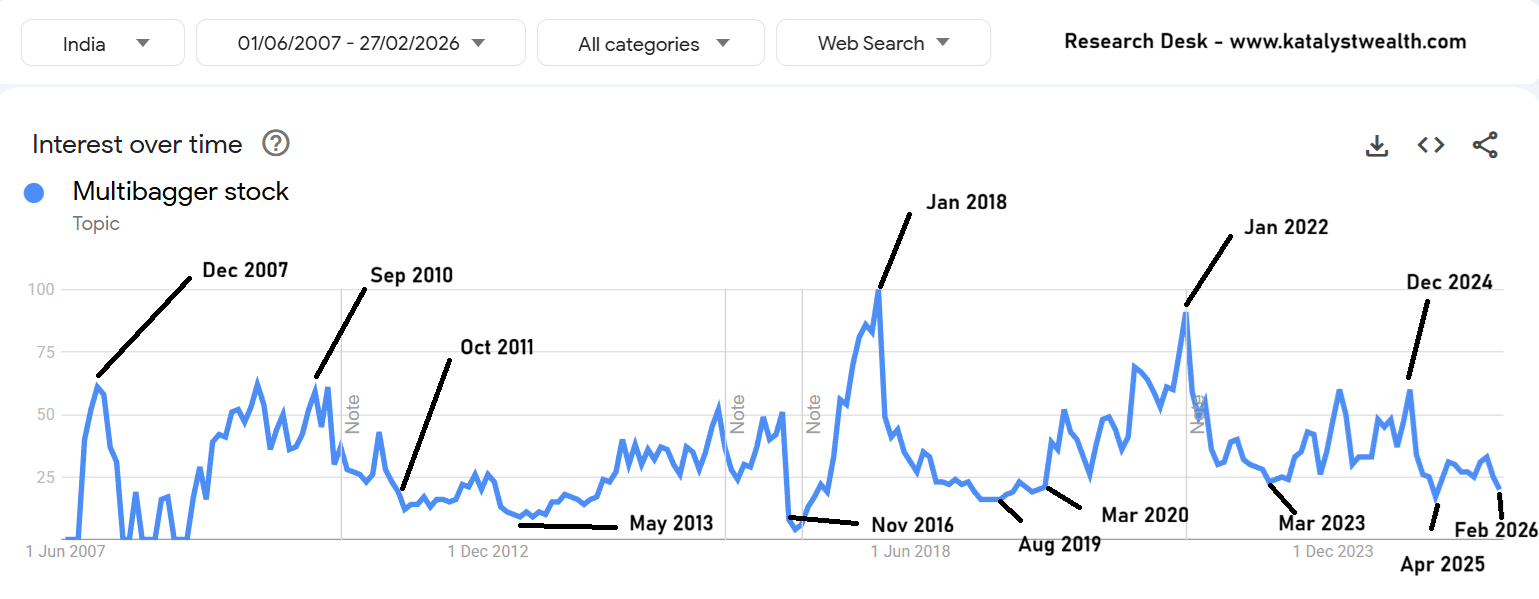
I’ve overlaid Google Trends data for “Multibagger stock” searches (India) from June 2007 to February 2026.
The pattern is striking — and disturbingly consistent:
When search interest PEAKS → Markets are near a top
When search interest BOTTOMS → That’s when real opportunities appear
Let me walk you through the history:
Peak #1: December 2007
Search Interest: Near all-time high
Market Context: Sensex at ~20,000, euphoria everywhere
What Happened Next: 2008 financial crisis. Market crashed 60% over the next 10 months.
Lesson: When everyone is searching for multibaggers, you’re already late. The multibaggers have already run.
Trough #1: May 2013
Search Interest: Rock bottom (near zero)
Market Context: Post-2011 crash malaise, FII outflows, policy paralysis
What Happened Next: The next 4 years (2014-2017) were a golden period for small and mid-cap stocks. Stocks that nobody wanted in 2013 became 5x-10x baggers by 2017.
Lesson: When nobody is interested in searching for multibaggers, that’s precisely when they’re being created — in silence.
Peak #2: January 2018
Search Interest: Second-highest peak after 2007
Market Context: Small and mid-cap bubble. Everything was going up. “Markets only go up” sentiment.
What Happened Next: Mid-caps corrected 30-40% over the next 18 months. Small-caps fell even harder.
Trough #2: March 2020
Search Interest: Absolute zero
Market Context: COVID crash. Panic. Nifty at 7,600. “Markets will never recover” narrative.
What Happened Next: The single biggest multibagger opportunity in a decade. Stocks that were available at ₹50 in March 2020 went to ₹500+ by 2021.
Lesson: When fear is at its peak and search interest is at zero, that’s when generational wealth is created.
Peak #3: January 2022
Search Interest: Third major peak
Market Context: Post-COVID rally euphoria. Retail participation at all-time high. Everyone was an “investor.”
What Happened Next: By 2023, small caps had corrected 40-50%. Many IPO-era darlings fell 70%+.
Where Are We Now? (February 2026)
Here’s the most important part:
Search interest for “Multibagger stock” has been DECLINING steadily since the December 2024 peak.
As of February 2026, we’re at levels last seen in April 2025 — and continuing to fall.
What Does This Mean?
Translation: Retail investors are getting exhausted. They’re losing interest. The excitement is fading.
And historically, that’s when patient money gets rewarded.
Think about it:
- When everyone was searching in 2007 → 2008 crash followed
- When nobody was searching in 2013 → 2014-17 boom followed
- When everyone was searching in 2018 → 2018-19 correction followed
- When nobody was searching in March 2020 → 2020-21 rally followed
- When everyone was searching in 2022 → 2022-23 correction followed
The pattern is consistent:
High search volume = Greed = Market top
Low search volume = Fear = Market bottom
Why Does This Work?
This isn’t some mystical indicator. It’s pure behavioral finance.
Retail investors search for “multibagger stocks” AFTER they’ve already seen their neighbor/colleague/uncle make money in the market.
By the time retail is actively searching for multibaggers:
- The easy gains have been made
- Valuations are stretched
- Smart money is quietly exiting
- The risk-reward is terrible
Conversely, when retail has STOPPED searching:
- They’ve been burned by losses
- Sentiment is negative
- Nobody wants to talk about stocks
- Valuations have normalized
- That’s when the next cycle’s multibaggers are quietly accumulating
As Warren Buffett said: “Be fearful when others are greedy, and greedy when others are fearful.”
Google Trends just quantifies the “greed” and “fear” for us.
What Should You Do With This Information?
I’m not saying “buy everything” or “sell everything” based on this indicator alone.
But here’s how I use it:
When Search Interest is HIGH (like 2007, 2018, 2022):
✅ Be more cautious with new deployments
✅ Book some profits in extended positions
✅ Increase quality bar for new investments
✅ Build a watchlist, don’t chase prices
✅ Increase cash allocation gradually
When Search Interest is LOW (like 2013, March 2020, now trending down):
✅ Deploy capital more aggressively
✅ Focus on quality businesses that got beaten down with the market
✅ Don’t wait for “perfect entry” — good businesses at reasonable prices are rare in bull markets
✅ Build positions in companies you’ve been researching
✅ This is when 3-5 year wealth is created
Current Actionable Insight (February 2026)
Right now, search interest is declining from the December 2024 peak.
We’re not at “March 2020 levels” yet (absolute despair), but we’re moving in that direction.
What this tells me:
The froth is coming out. Retail is losing interest. The weak hands are exiting.
This is early-stage opportunity formation — not peak opportunity yet, but getting there.
My approach right now:
- Building watchlists of quality businesses that have corrected 20-30%+ from highs
- Deploying capital selectively in names where fundamentals are intact
- Not waiting for “the perfect bottom” — that only becomes clear in hindsight
The Bottom Line
You don’t need fancy tools to be a contrarian investor.
Sometimes, the best indicator is simply: What is the crowd doing?
When the crowd is frantically searching for multibaggers → Stay cautious.
When the crowd has given up and stopped searching → Start hunting.
The best time to search for multibaggers is when nobody else is searching.
The data from 19 years is clear. The pattern repeats. Human behavior doesn’t change.
Right now, in February 2026, the crowd is slowly walking away.
For patient investors, that’s not a warning sign.
That’s an invitation.
Hope you found the blog post useful and it added value to your investment decisions. Sign up for more interesting stock ideas and industry notes.
Disclaimer: This is not a recommendation to buy/sell any of the stocks mentioned above. The securities quoted are for illustration only and are not recommendatory.
Ekansh Mittal
Research Analyst
SEBI Research Analyst Registration No. INH100001690
Research Analyst Details
Name: Ekansh Mittal Email Id: (opens in new tab)[email protected] Ph: +91 727 5050062
Details of Associate: Not Applicable
Analyst Certification: The Analyst certify (ies) that the views expressed herein accurately reflect his (their) personal view(s) about the subject security (ies) and issuer(s) and that no part of his (their) compensation was, is or will be directly or indirectly related to the specific recommendation(s) or views contained in this research report.
Disclaimer: (opens in new tab)http://www.
Registered Address – 7, Panch Ratan, 7/128, Swaroop Nagar, Kanpur – 208002
Place of Business – 205, Ratan Floor, 113/120, Swaroop Nagar, Kanpur – 208002
Compliance Officer/Grievance Redressal – Mr. Ekansh Mittal, +91-9818866676, (opens in new tab)info@
“Registration granted by SEBI and certification from NISM in no way guarantee performance of the intermediary or provide any assurance of returns to investors”.
“Investment in securities market are subject to market risks. Read all the related documents carefully before investing.”
The views expressed are based solely on information available publicly and believed to be true. Investors are advised to independently evaluate the market conditions/risks involved before making any investment decision
This report is for the personal information of the authorized recipient and does not construe to be any investment, legal or taxation advice to you. Ekansh Mittal/Mittal Consulting/Katalyst Wealth is not soliciting any action based upon it. This report is not for public distribution and has been furnished to you solely for your information and should not be reproduced or redistributed to any other person in any form. This document is provided for assistance only and is not intended to be and must not alone be taken as the basis for an investment decision. Ekansh Mittal or any of its affiliates or employees shall not be in any way responsible for any loss or damage that may arise to any person from any inadvertent error in the information contained in this report. Neither Ekansh Mittal, nor its employees, agents nor representatives shall be liable for any damages whether direct or indirect, incidental, special or consequential including lost revenue or lost profits that may arise from or in connection with the use of the information. Ekansh Mittal/Mittal Consulting or any of its affiliates or employees do not provide, at any time, any express or implied warranty of any kind, regarding any matter pertaining to this report, including without limitation the implied warranties of merchantability, fitness for a particular purpose, and non-infringement.
The recipients of this report should rely on their own investigations. Ekansh Mittal/Mittal Consulting and/or its affiliates and/or employees may have interests/ positions, financial or otherwise in the securities mentioned in this report. Mittal Consulting has incorporated adequate disclosures in this document. This should, however, not be treated as endorsement of the views expressed in the report.
We submit that no material disciplinary action has been taken on Ekansh Mittal by any regulatory authority impacting Equity Research Analysis.
Use of Artificial Intelligence: RA may infrequently use Artificial Intelligence (AI) tools like chatgpt, notebooklm, etc. in its research services to enhance the quality and efficiency of the recommendations provided to clients. The tools are primarily used for data collection and generating con-call summaries for the purpose of research.
In accordance with Regulation 24(7) of the SEBI (Research Analyst) Regulations, 2014: We take full responsibility for the security, confidentiality, and integrity of client data used in conjunction with AI tools and we ensure compliance with applicable laws regarding the use of AI tools.
Disclaimer: You can access it here – (opens in new tab)LINK
Whether the research analyst or research entity or his associate or his relative has any financial interest in the subject company/companies and the nature of such financial interest – No
Whether the research analyst or research entity or his associates or his relatives have actual/beneficial ownership of 1% or more securities of the subject company (at the end of the month immediately preceding the date of publication of the research report or date of the public appearance) – No
Whether the research analyst or research entity or his associate or his relative has any other material conflict of interest at the time of publication of the research report or at the time of public appearance – No
Whether it or its associates have received any compensation from the subject company in the past twelve months – No
Whether it or its associates have managed or co-managed public offering of securities for the subject company in the past 12 months – No
Whether it or its associates have received any compensation for investment banking or merchant banking or brokerage services from the subject company in the past 12 months – No
Whether it or its associates have received any compensation for products or services other than investment banking or merchant banking or brokerage services from the subject company in the past 12 months – No
Whether the subject company is or was a client during twelve months preceding the date of distribution of the research report and the types of services provided – No
Whether the research analyst has served as an officer, director or employee of the subject company – No
Whether the research analyst or research entity has been engaged in market making activity for the subject company – No